How does normalization work in MelanieTM?
Why is normalization needed?
2D gel electrophoresis experiments typically aim at comparing different samples in order to identify protein expression changes that are characteristic of those samples. Nevertheless, relevant expression changes are often obscured by systematic experimental variation such as:
- Differences in sample preparation (inconsistent amounts of starting material, variations in reagents or protocols, pipetting errors)
- Differences in sample loading (pipetting errors, sample loss during gel loading)
- Differences in staining/labeling (inconsistent staining times, differences in labeling efficiency between CyDyes)
- Differences in image acquisition (inconsistent exposure times, inconsistent settings for image captures, differences in excitation/emission efficiency between fluorescent dyes)
These sources of variation will affect different 2D gels or images to different extents, complicating the comparison of protein abundance across 2D images. The process of compensating for these variations – unrelated to the biological expression changes – is called normalization.
The key assumptions for normalization
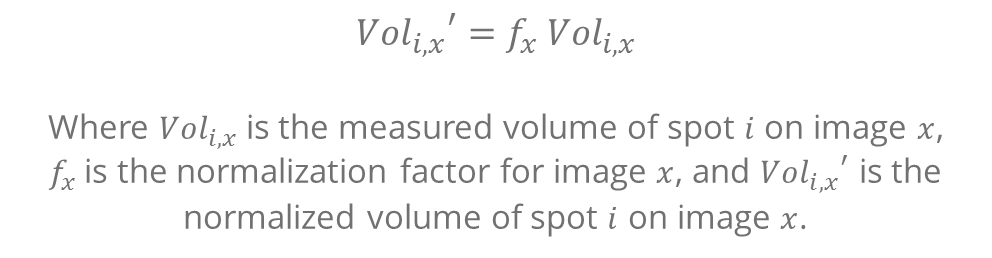
In principle, all proteins represented in a given 2D gel image are affected equally by the experimental factors mentioned above. Their relative abundance within the image is not changed. If one further assumes that most proteins do not change in abundance between samples, then a normalization factor f can be calculated for each image to globally adjust its abundance distribution to be on the same scale as that of a reference image:
Normalization in Melanie
Melanie offers several methods to estimate this normalization factor: Ratiometric normalization, Spike normalization and Total volume normalization. If none of these methods seem suitable for your data set, you can also choose the option No normalization.
At all times, the reported Vol and Vol Ratio values in the software correspond to the normalized volumes for the selected normalization method. To report non-normalized volumes, just choose the option No normalization.
The normalization reference
The normalization reference is selected automatically and shows as the image with the darkest green label in the Spot normalization mode:
- For DIGE experiments with an internal standard, the normalization reference for a sample will always be its within-gel internal standard. In addition, each internal standard image is normalized against one of the internal standard images selected as a reference. This reference is the internal standard image with the total spot volume – calculated over all spots – that is closest to the mean total spot volume for all internal standards. Note that the normalization of the internal standard images does not influence the Vol Ratio values. However, it is taken into account to calculate the Intensity and Vol, and it is used to normalize the 3D view. This ensures that the relative peak heights in the 3D views are consistent with the calculated Vol Ratios.
- For conventional 2D gel experiments and DIGE experiments without an internal standard, the details of the reference selection depend on the normalization method and will therefore be described in the corresponding sections. For such experiments, you can choose the normalization method, but also the image groups within which the normalization shall occur (see below). There will be one reference image per image group in the selected option.
Note that the normalization reference is likely to be different from the alignment reference. Also be aware that the selection of the normalization reference is reevaluated at each edition of your project. This comprises inclusion or removal of images, as well as edition of alignment, detection or spots.
The image groups for normalization
In some experiments, it may not be appropriate to normalize all images to a single reference. For instance, to study the effect of a treatment on the protein expression in very different sub-cellular fractions, it may be more appropriate to normalize only within samples of the same fraction. This will provide accurate quantitative abundance measurements for the treatment effect within each fraction, even if you may only draw qualitative conclusions from comparisons between fractions.
By default, normalization is carried out on the Entire data set, as will show the option in the within box in the Spot normalization mode. To normalize images only within groups of images, called normalization groups, select the appropriate option in the within box. This will immediately update the Normalization factor table to show the normalization groups, the normalization reference for each group, and the recalculated normalization factors.
The spots used for normalization
The spots used to calculate the normalization factor will depend on the normalization method. You will recognize these spots in the Normalization plot and on the images by their red color. The number of spots used for the normalization can be found in the Markers, Spikes or Spots column in the Normalization factor table, depending on the normalization method.
When the Spike normalization option is selected, you must define the spike proteins that will be used for the normalization. Select one or several spike proteins on one of the images, and then tick their box in the Spikes column of the Normalization table.
The normalization methods
Ratiometric normalization
Ratiometric normalization is based on the volume ratios between every spot pair of the sample and reference image, and assumes that the majority of proteins are unregulated.
Ratiometric normalization uses the following process to compute a normalization factor for each image, and to normalize the spot volumes:
- The reference image for the normalization is determined. For DIGE experiments including an internal standard, the reference image is always the within-gel internal standard. For all other data sets, and for the internal standard images, the reference image will be the image with the total spot volume – calculated over all spots included in the analysis – that is closest to the mean total spot volume for all images in the normalization group.
- Next, only the 50% most conserved spots throughout the normalization group are kept. This is done by selecting the spots with lowest coefficient of variation (CV).
- Then, for each spot, the mean log volume of the spot in the sample and reference image is calculated. This value is reported as Mean Volume in the plot and table. By default, only the top 50% of the spots, based on Mean Volume, are kept for the calculation of the normalization factors of all images in the data set. But you can change this percentage and/or exclude also high volume spots in the Workflow options.
- For each spot pair of the sample and reference image, a volume ratio is calculated. The normalization factor between the images is computed by taking the median of the volume ratios for all spots that were retained for the normalization. As the median is not affected by the extreme values, this works even for experiments with a high number of regulated spots.
- The spot volumes in each normalized image are multiplied with the normalization factor for that image.
Spike normalization
The default ratiometric normalization is not optimal for samples that have few protein spots or where the majority of the proteins differ in expression level between samples. Spike normalization allows to normalize the protein spots in an experiment to user selected proteins in the samples.
In principle, the user selected proteins correspond to spike proteins that were added to each sample prior gel running. It is important to select spike proteins with a minimum of overlay with any protein spots in the experiment images, to avoid interference with the differential analysis. So called housekeeping proteins of the sample itself (proteins known to be of constant concentration in all samples) can also be used for the spike normalization procedure.
Spike normalization is also based on the volume ratios between spot pairs of the sample and reference image. However, this method only considers that the spike proteins (Spikes) are unregulated.
Spike normalization uses the following process to compute a normalization factor for each image, and to normalize the spot volumes:
- Only protein spots marked as Spikes are considered for the normalization.
- The reference image for the normalization is determined. For DIGE experiments including an internal standard, the reference image is always the within-gel internal standard. For all other data sets, and for the internal standard images, the reference image will be the image with the total spot volume – calculated over all Spikes – that is closest to the mean total spot volume for all images in the normalization group.
- For each spot pair of the sample and reference image, a volume ratio is calculated. The normalization factor between the images is computed by taking the median of the volume ratios for the Spikes.
- The spot volumes in each normalized image are multiplied with the normalization factor for that image.
Total volume normalization
In this method, each spot on a gel image is expressed relative to the total volume of all spots on that image, and then normalized to the total volume of all spots on the reference image. It comes down to using the %Vol.
Total volume normalization uses the following process to compute a normalization factor for each image, and to normalize the spot volumes:
- All spots are considered for the normalization.
- The reference image for the normalization is determined. For DIGE experiments including an internal standard, the reference image is always the within-gel internal standard. For all other data sets, and for the internal standard images, the reference image will be the image with the total spot volume – calculated over all spots – that is closest to the mean total spot volume for all images in the normalization group.
- The normalization factor, as shown below, corresponds to the ratio of the total volume of all spots on the reference image to the total volume of all spots on the sample image.
- The spot volumes in each normalized image are multiplied with the normalization factor for that image.

No normalization
In some specific cases, it may be more appropriate not to apply any normalization. You can use the option No normalization to use the non-normalized spot quantities (Vol, %Vol, Vol Ratio).