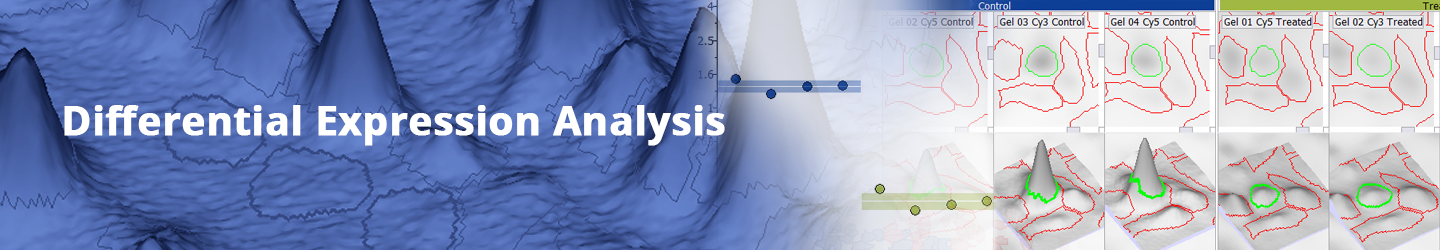
Melanie is a comprehensive software solution for the visualization, matching, detection, quantitation, and analysis of 2D gel electrophoresis (2DE) and Western blot images. Its Melanie Classic and DIGE modules help scientists investigate biological processes by characterizing samples in terms of relative protein abundance and posttranslational modifications. These modules have been designed to detect statistically significant differences in protein expression between experimental groups, with high objectivity, sensitivity and confidence.
Melanie Classic offers all the functionality you need to analyze experiments consisting of conventional 2-DE gels. Melanie DIGE additionally includes specific functionality for the analysis of DIGE gels so that you can fully exploit the advantages offered by multiplexing.
Protein expression analysis can be used in many applications:
- Discovery of biomarkers (proteins or protein patterns associated with a specific biological state)
- Development of diagnostic tests
- Study of the effect of certain compounds (e.g. drugs) or conditions on proteins expressed by an organism.
- Quality control of food samples
- Investigation of structure and function of proteins
| Melanie supports differential protein expression analysis for a wide range of 2D-PAGE based methods: |
Conventional 2D gel electrophoresis
|
2D differential in gel electrophoresis (2D-DIGE), using an internal standard
|
Other multiplexed technologies without internal standard
|
| Melanie supports all common detection agents, including fluorescence, colorimetric and functional group-specific stains. Similarly, all industry-standard image formats can be analyzed, including TIFF, GEL, MEL, IMG/INF, GSC and 1SC files. Melanie also opens DS files for automatic import of DIGE gels. |
Simple workflow
Melanie guides you through the image analysis process with a user-friendly step-by-step workflow, delivering quick results. With the control and validation tools dedicated to each analysis stage, you can feel confident that you accomplish the necessary steps and checks for the highest quality results.
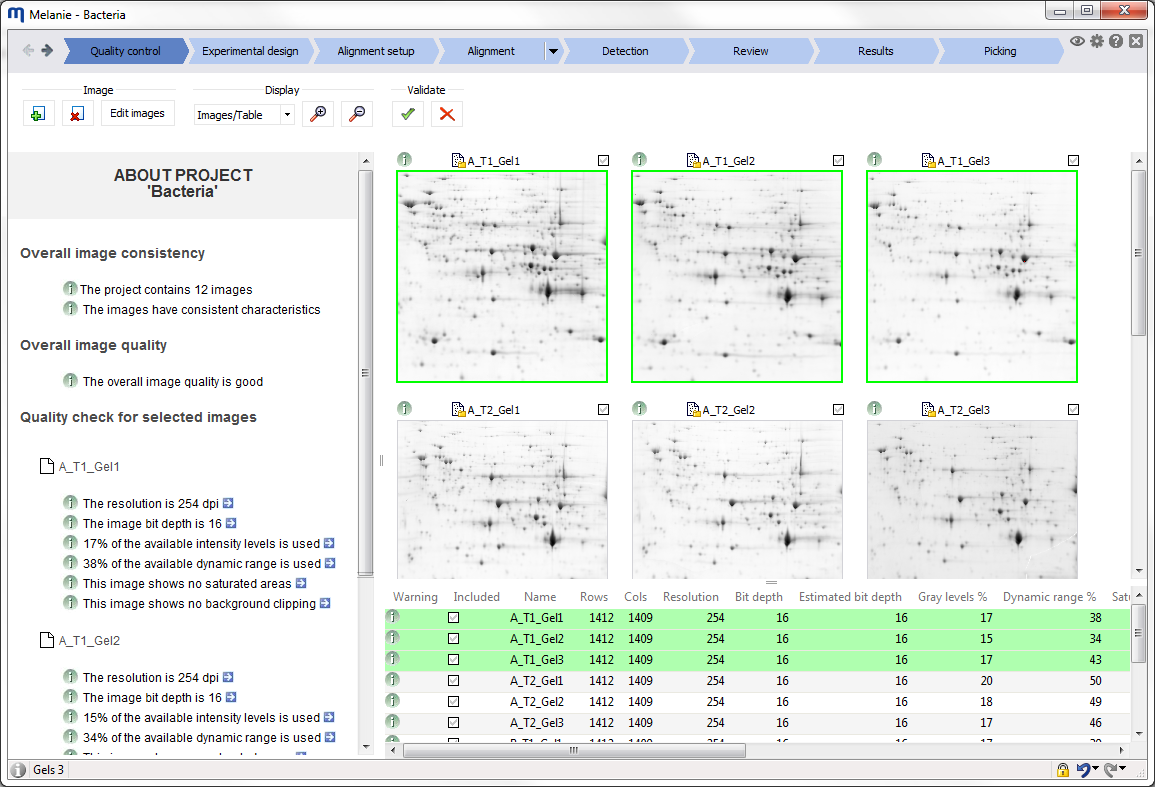
| Quality control
Check the quality and consistency of your images
Import and visualize your images. Verify Melanie’s automatic image quality feedback. This helps decide whether your gels or blots need to be re-scanned or edited (cropped, flipped, rotated, scaled, inverted). Then validate the images you want to take forward for further analysis.
You can carry out pI/MW calibration by defining a few pI and MW markers in the dedicated interface. Melanie will then calculate theoretical pI and/or MW values for all spots. |
 |
|
|
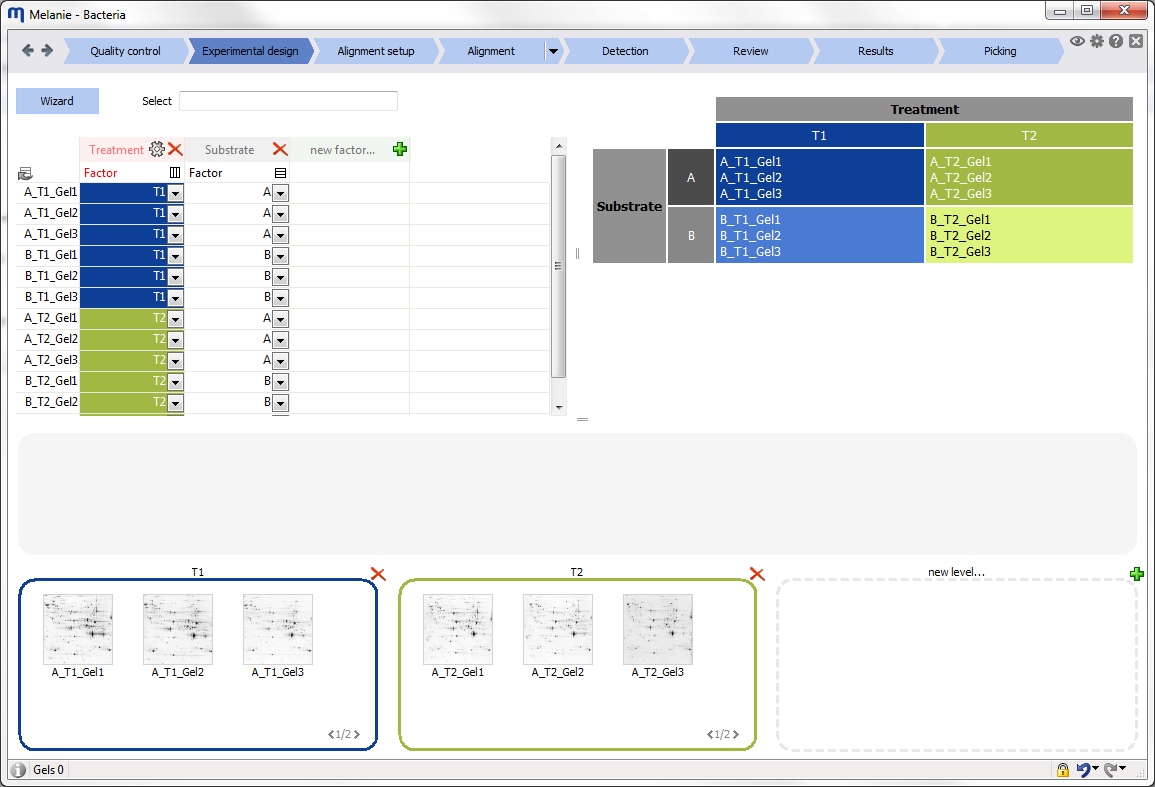
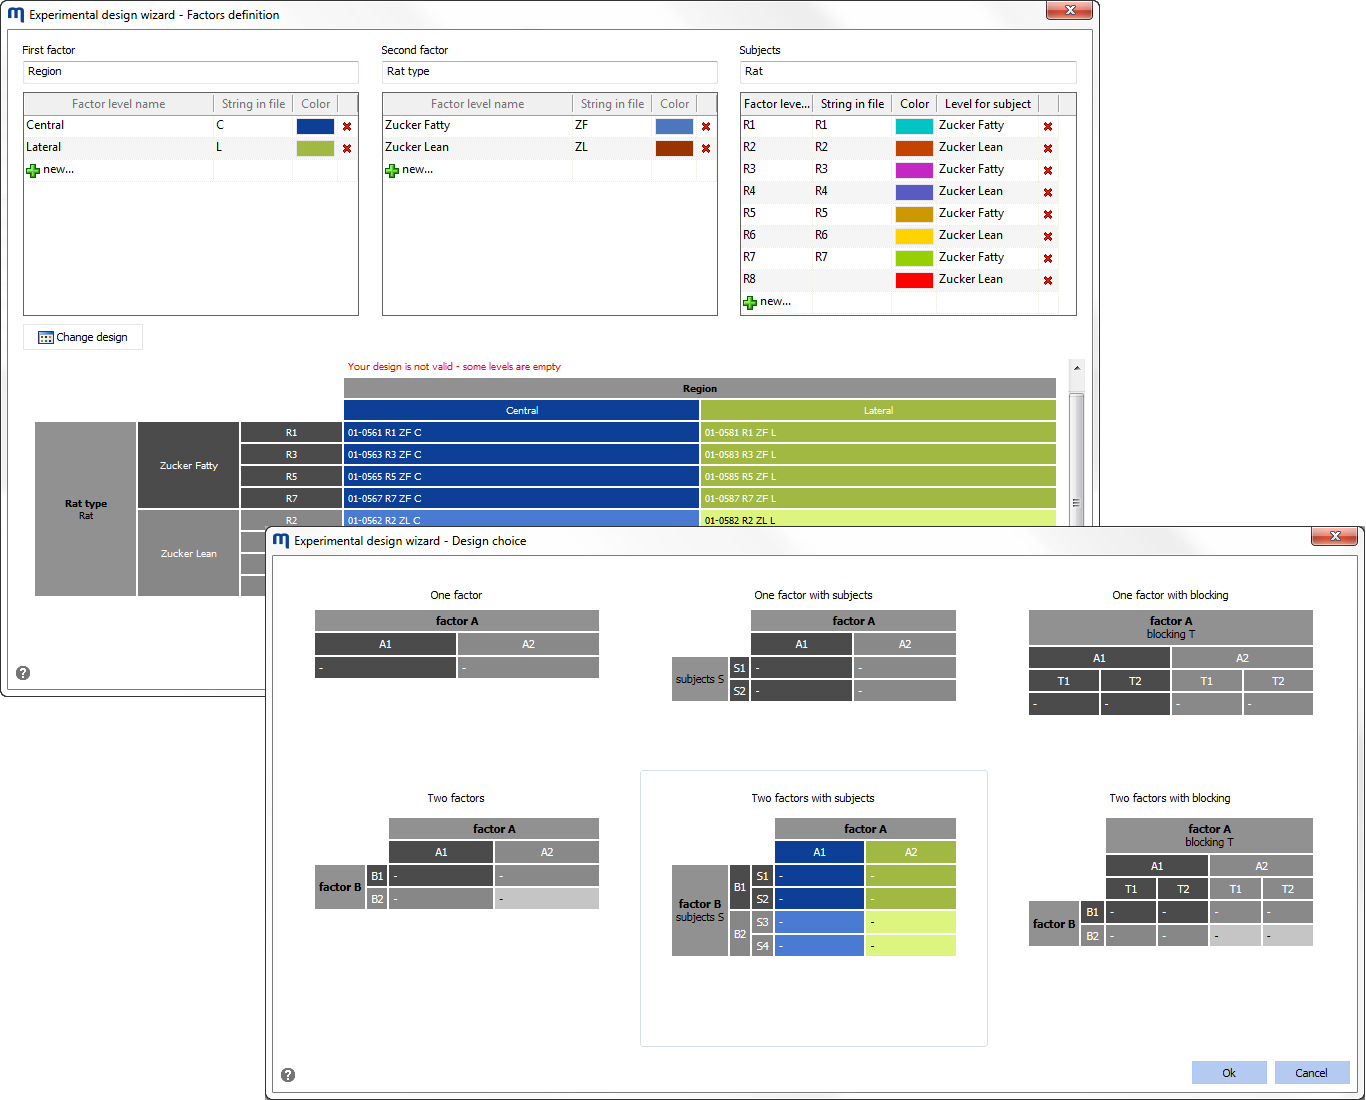
| Experimental design
Define the experimental design variables
Use the Experimental design wizard to create one of the common designs, define factors and factor levels, and assign images to the different treatments. Specify additional variables you might want to investigate, and ensure you have a consistent and balanced experimental design. |
 |
|
|
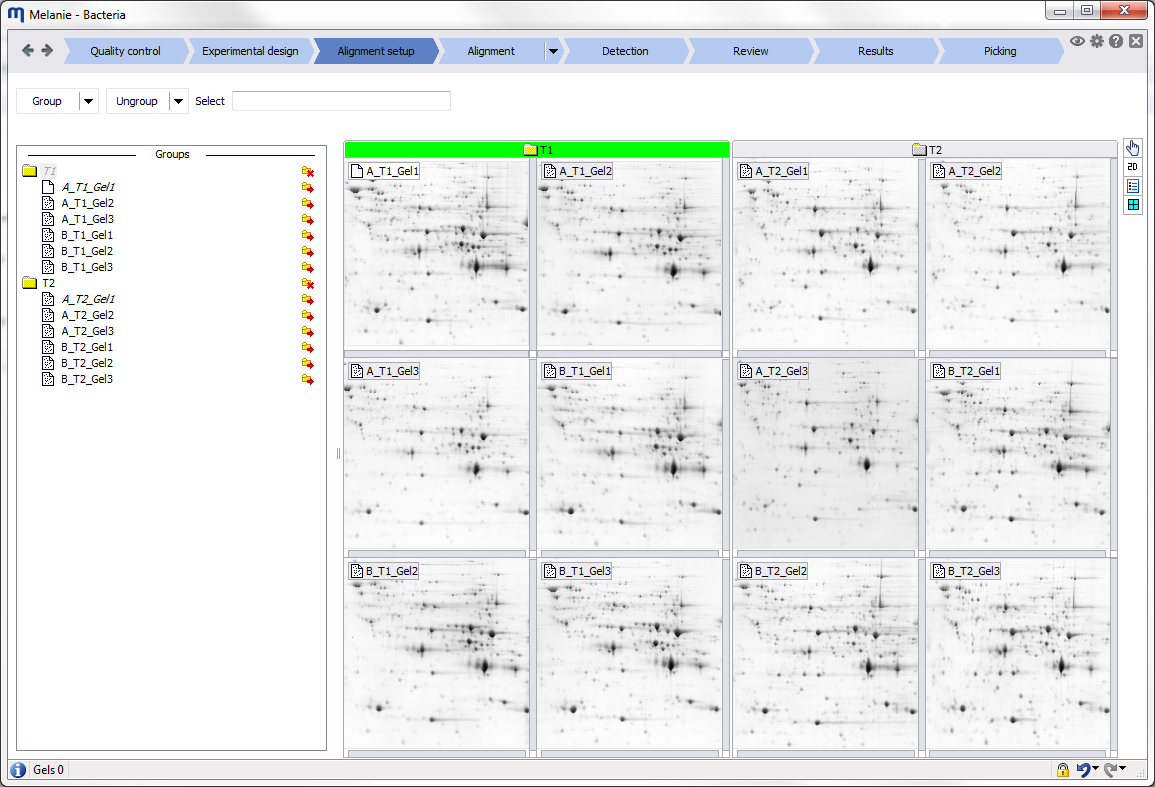
| Alignment setup
Specify an alignment strategy to increase match efficiency
Optimize alignment efficiency by aligning images first within groups of similar images. The different groups will be matched by aligning their respective reference images. You can group images based on factors defined in the Experimental design or build your own group hierarchy based on knowledge about your images. |
 |
|
|
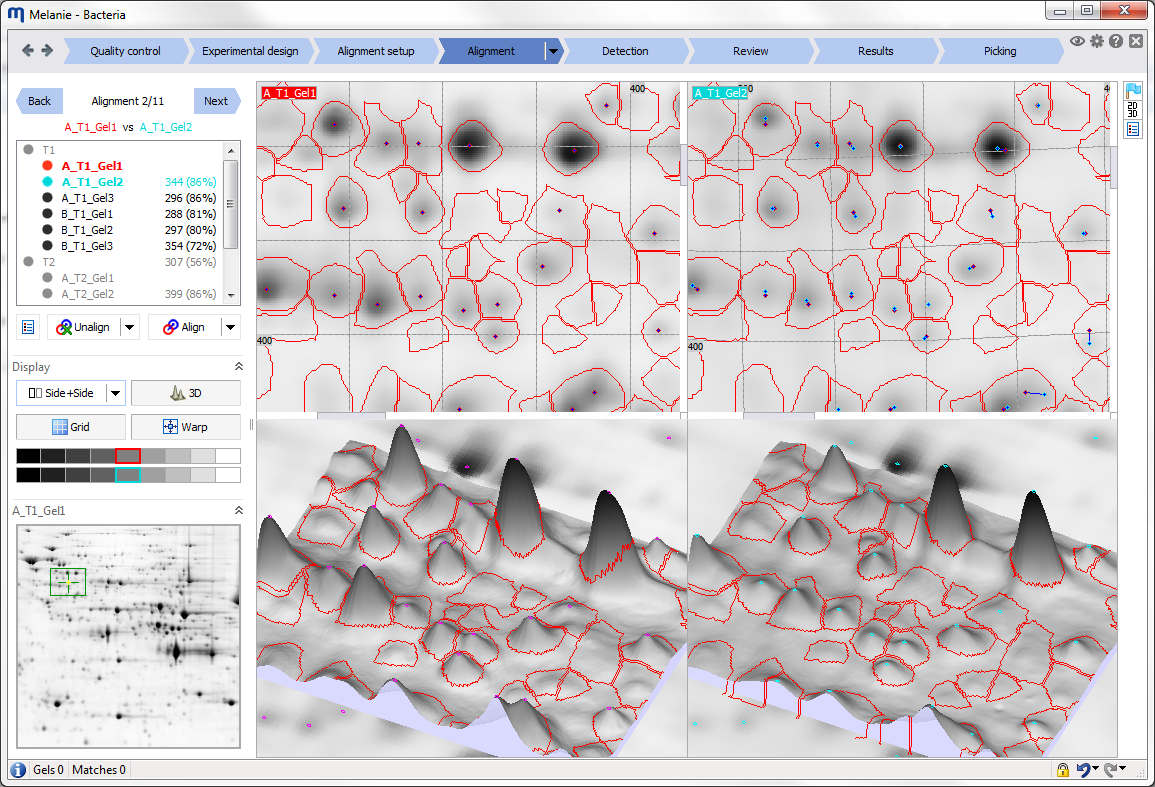
| Alignment
Align images to remove positional variation between gels
Use the automatic alignment algorithm to remove positional variation between gels. Then systematically review each alignment pair using the dedicated tools and edit matches where necessary. |
 |
|
|
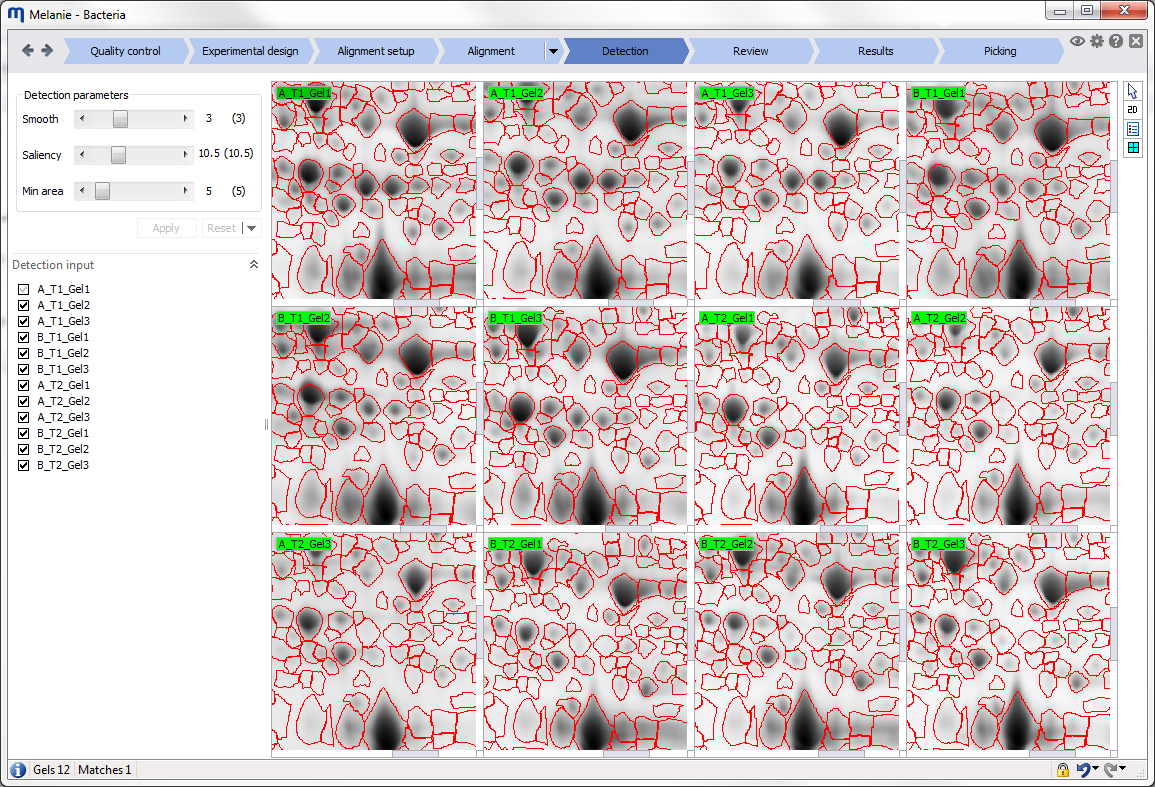
| Detection
Detect and quantify spots on all images
Fine-tune the detection parameters and choose the images that will be used to generate a representative spot pattern. |
 |
|
|
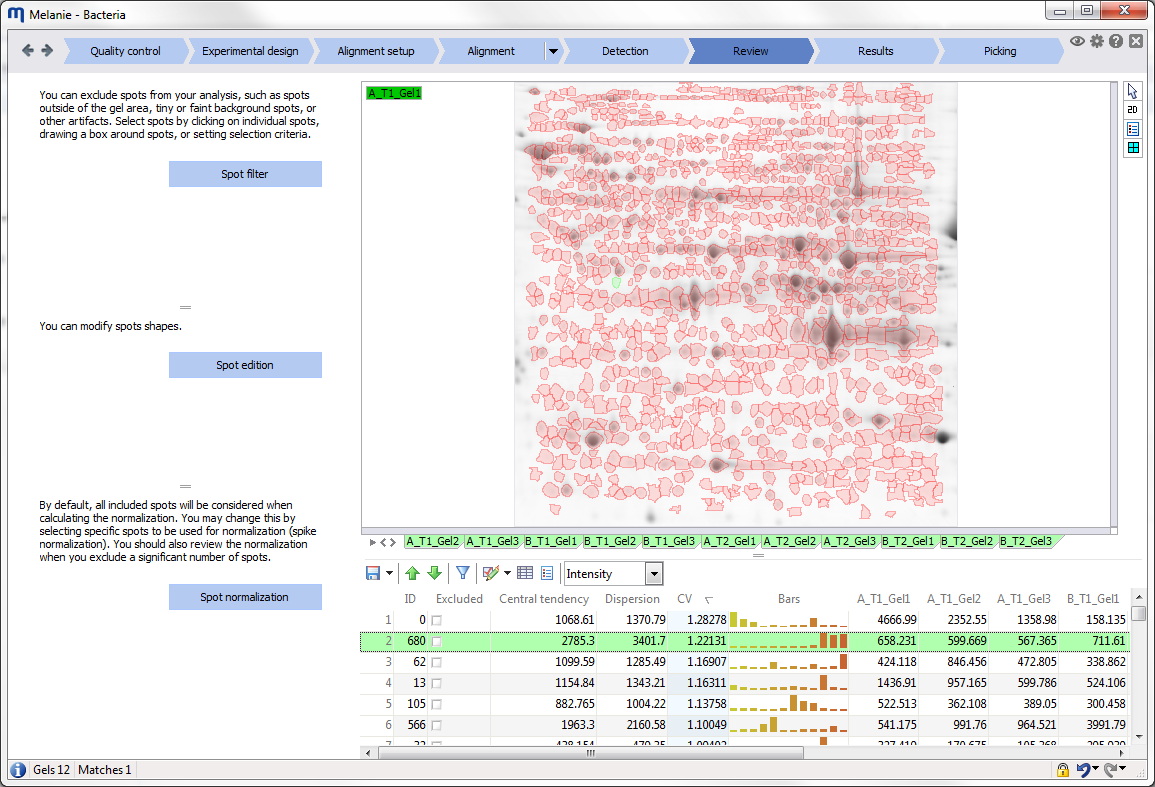
| Review
Filter or edit spots, and review the normalization
Check the spot pattern, edit spots or make corrections in the alignment if needed. Select irrelevant spots either manually or based on advanced filter criteria, and exclude them from further analysis. Then review the normalization before continuing with the statistical analysis. |
 |
|
|
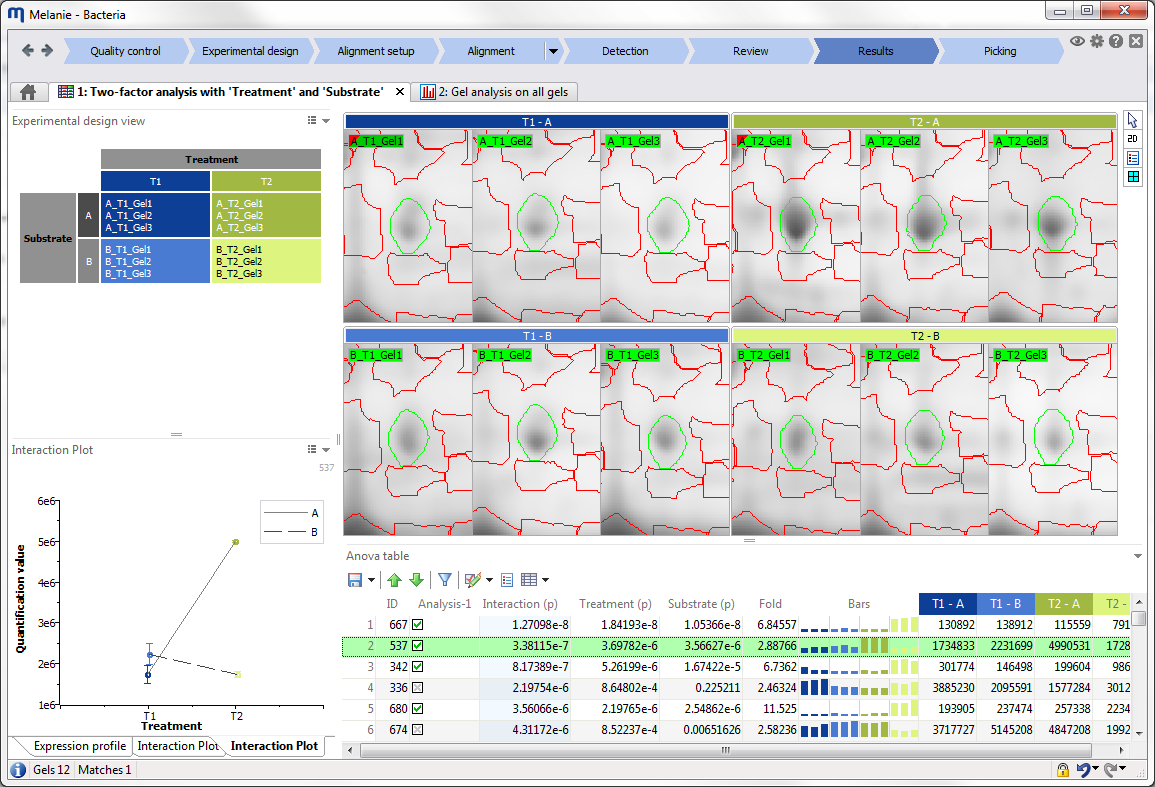
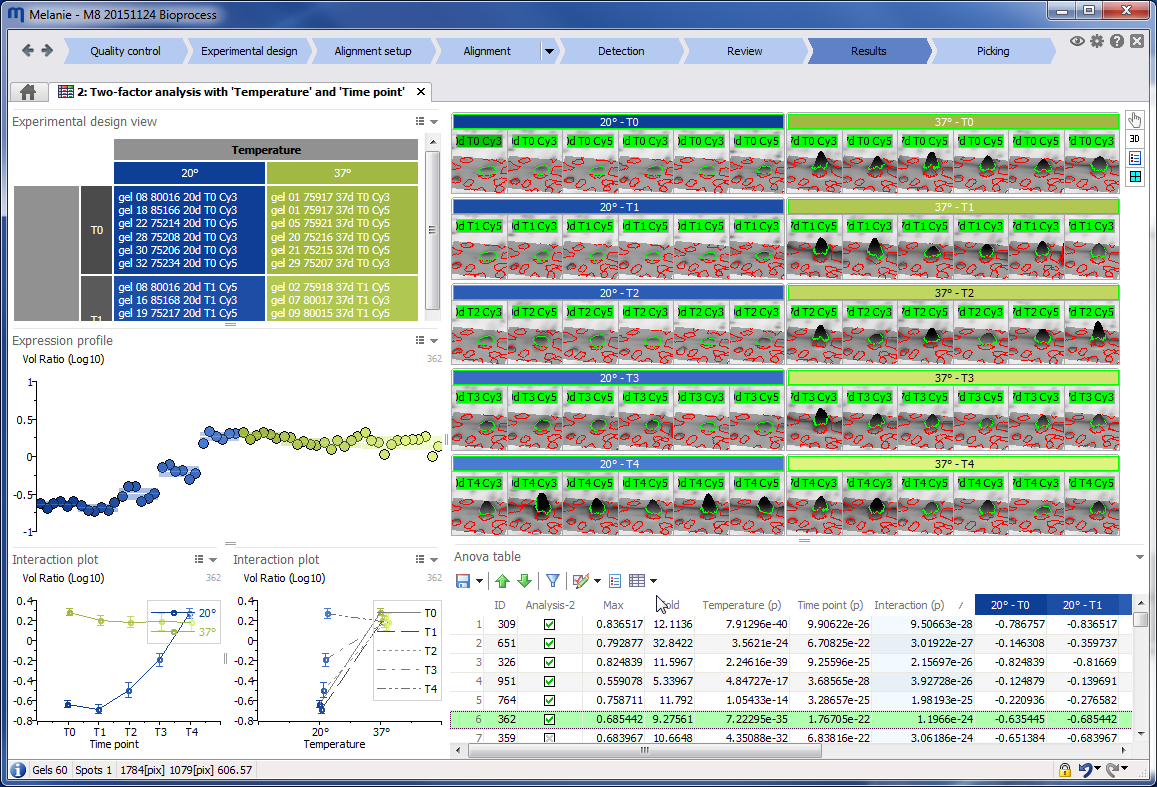
| Results
Explore and validate your results
Identify spots of interest with the dedicated tools and statistical tests that are automatically adapted to your experimental design. Validate spots using spot filters, advanced annotations, various plots, and versatile viewing options. |
 |
|
|
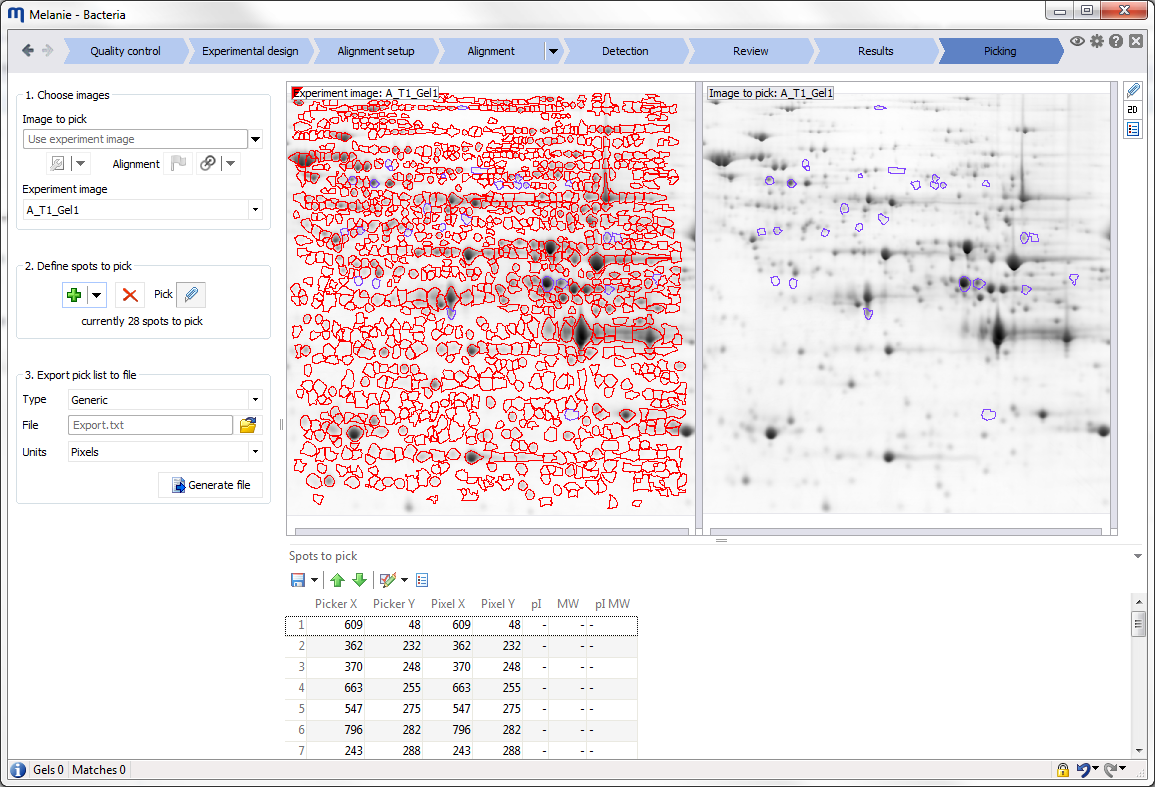
| Picking
Choose and export spots for picking
If you will be picking from a preparative gel rather than from one of the analytical gels in your experiment, add the image of your pick gel at this stage and align it to one of the other images. Then choose spots for picking and export them for further downstream analysis. |
 |
Key benefits
 |
Detect significant differences in protein expression with high sensitivity for meaningful and dependable results
- Specify your experimental design easily so the advised statistical test considers the actual structure of your data
- Get 100% spot matching and no missing values in your statistical analysis
- Precisely position matches during 3D assisted alignment editing
- Adjust detection parameters in 3D to ensure that even faint spots are detected and overlapping spots are correctly split
- Tweak advanced normalization options to compensate for systematic experimental variation
|
 |
Improve productivity with time-saving features so you can swiftly move on to your next high value experiments
- Optimize image capture with quality control feedback, to avoid wasting time analyzing images that are unlikely to deliver relevant results
- Start faster with the step-by-step workflow
- Use strategies that increase alignment efficiency and minimize match editing work
- Exploit shortcuts at all stages of the analysis by specifying your experimental design from the start
|
 |
Minimize user bias and make your analysis more reproducible so you can feel confident about taking informed and objective decisions
- Include all images to generate the shared spot pattern, for direct spot comparisons and minimal manual editing
- Review spot edits using both 2D and 3D views across all images
|
 |
Select and validate proteins of interest for picking and downstream analysis, to save time and money with fewer false positives
- Get specific statistical support for many common experimental designs, including one- and two-way ANOVA incorporating a subject or blocking factor
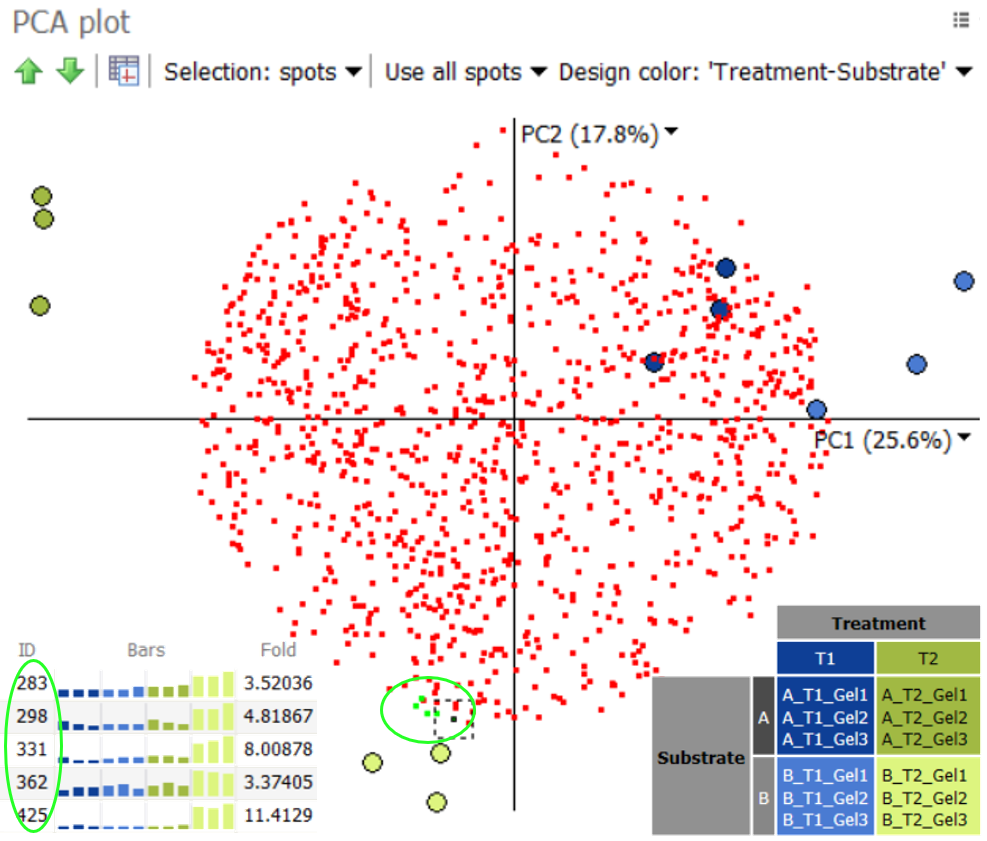
- Apply PCA to identify outliers in the data, check whether gel images cluster as expected or find spots with similar expression profiles
- Study protein abundances and variability with expression profiles, interaction plots and various spot statistics
- Validate proteins using spot filters, annotation and tagging, and versatile viewing options
|
 |
Share, submit and publish your results with flexible data export options, so you can effectively collaborate with researchers worldwide
- Automatically generate a comprehensive PDF report of your entire analysis, summarizing all essential quality control checks, analysis parameters, results, images, tables and plots in a single document. A detailed spot measurements report can be generated as a referenced appendix
- Easily visualize and export critical analysis parameters such as position of alignment vectors and spots that were excluded or edited
- Save, print or copy to clipboard all project data, tables and images (2D and 3D views, graphical reports, Display area, Application window)
- Let colleagues review your analysis by means of the software’s free viewer functionality
- Carry out pI/MW calibration to help interpretation of mass spectroscopy-based identification data
|
Feature focus
|
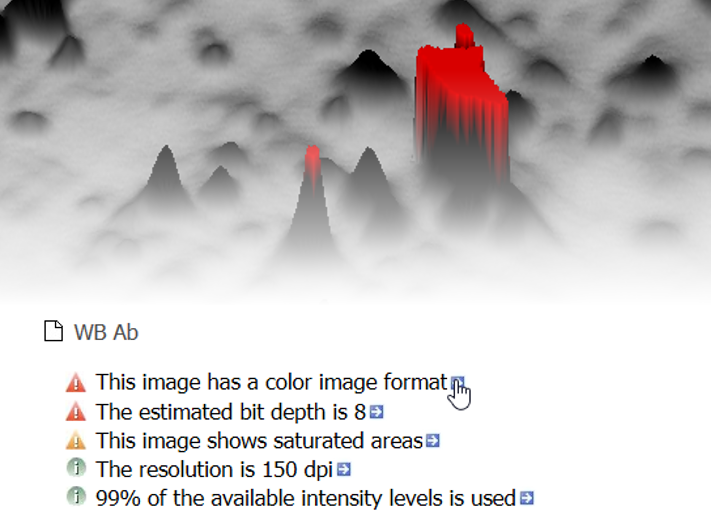
Image quality control
Melanie automatically controls the quality of your images so that you get the necessary feedback to optimize your image capture procedures. It also checks that all images in the data set have consistent characteristics such as size or intensity encoding. Potential issues are highlighted and information provided on how to solve them.
This quality control step will save the time that would otherwise be required to analyze images with only limited potential to deliver relevant results. |
| Experimental design centered
The proper design of an experiment is crucial to obtain relevant results from any 2-D gel electrophoresis study. We believe you should be able to fully exploit your experimental design information at all stages of the analysis. Melanie‘s experimental design wizard helps you describe common one- and two-factor designs and seamlessly assign images to the different factor levels.
The experimental design structure is subsequently used throughout the analysis workflow to propose specific alignment strategies, image display layouts, and appropriate statistical tests and data analysis tools.
|
|

|
Efficient alignment strategies
Alignment is the most critical and time consuming step in the analysis. Melanie allows you to increase alignment efficiency and minimize match editing work by defining an appropriate alignment strategy. This avoids aligning all images to a single reference that may be quite dissimilar to many gels in the data set and would therefore generate an unnecessarily large number of difficult alignments. |
| Alignment
Alignment is the process of removing the positional variation inherent to electrophoresis. When juxtaposing images from different physical objects, proper alignment is essential to avoid misinterpretation of the data. For experiments that use DIGE, intra-gel alignment is not needed.
Alignment is accomplished by finding spot matches between an image in the experiment and its reference image, and then warping the image so that its spots precisely superimpose with those of the reference image. While the Melanie matching algorithm automatically pairs corresponding spots, you can manually edit matches where necessary. Alignment editing views and tools let you work in the way that is most efficient for you:
- Select your preferred display option during alignment (side-by side, dual color, blink)
- View warped or original images
- Display a grid to visualize deformations in aligned gels
- Edit matches in 3D during alignment review, for exceptional alignment accuracy
|

|
|
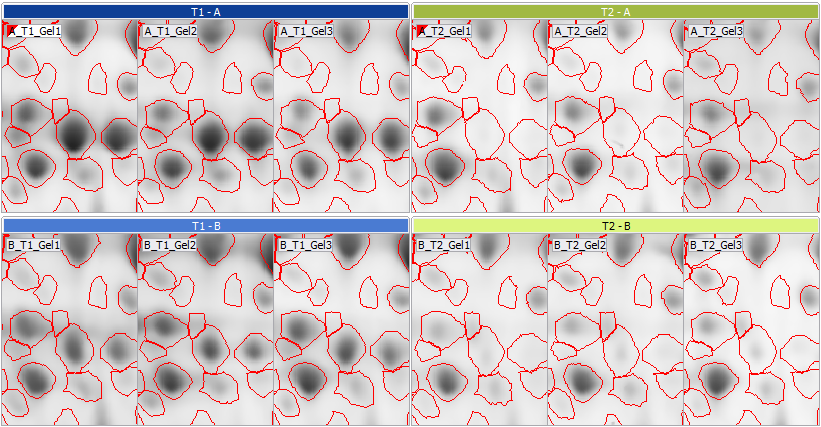
100% matching and identical spot patterns for all images
Once all images are aligned, Melanie detects spots on a composite image and propagates the spot boundaries to all images in the experiment. As a result, you will have virtually identical spot patterns on every gel and 100% spot matching, without missing values in your statistical analysis.
Where required, you can add spots, split, merge, grow, shrink or move spots, and exclude irrelevant spots from further analysis. These edits are performed on all images simultaneously, maintaining 100% spot matching throughout the data set, thus ensuring highly reproducible, objective results that you can report with confidence.
|
| Advanced normalization options
The spot abundances used in Melanie can be normalized using one of the available normalization functions. The default ratiometric normalization method, as well as the alternative total volume normalization method work on the assumption that the majority of all proteins in a gel maintain their overall expression level between the various samples in an experiment. When this supposition cannot be made, spike normalization can be chosen. This option normalizes data to spike proteins, which were either added to the samples or are already present as housekeeping proteins known to have a constant concentration.
In some experiments where spike normalization is not possible or practical, it may not be appropriate to normalize all images to a single reference. For instance, to study the effect of a treatment on the protein expression in very different subcellular fractions, it may be more appropriate to normalize only within samples of the same fraction. This will give accurate quantitative abundance measurements for the treatment effect within each fraction, even if you may only draw qualitative conclusions from comparisons between fractions. Melanie enables this capability by letting you specify groups within which you want to normalize.
|

|
|
Statistical support for one- and two-factor analyses
Melanie offers specific statistical support for the most common one- and two-factor experimental designs, including designs that comprise a subject or blocking factor. This feature is important, because a carefully designed experiment can still be wasted if subsequent statistical analysis does not take into account the structure of the data. By applying the appropriate model for the Analysis of Variance (ANOVA), your ability to detect true differences will improve considerably.
For experiments that have been designed to study three or more primary factors, or that integrate more advanced design notions and are therefore not specifically supported, you can still align and detect your images, filter, edit and normalize spots, and use some of the statistical tools for exploration. You can then export your data for more in-depth statistical analysis with third party software, under the guidance of a statistician.
|
Versatile analytical methods
The various analytical methods in Melanie Classic and DIGE can be used to select proteins for picking, digestion, and subsequent analysis by mass spectrometry. You can select proteins of interest based on criteria such as statistical significance of change, magnitude of change, spot abundance, or any combination of criteria. The available analytical methods are:
- Statistical tests, to perform differential expression analysis. Depending on your design, one-way or two-way ANOVA will be applied. The statistical significance of change can be used to reduce the data set to only those proteins that show a defined change in expression level.
- Principal component analysis (PCA) to identify outliers in the data and check whether gel images cluster according to the experimental design groupings.
- Expression profiles and interaction plots, to visualize the protein abundances and variability in different sample groups.
- Descriptive statistics such as the mean, standard deviation, and coefficient of variation, to summarize the magnitude and variability of the spot values within a population. The Fold change can be used to compare expression levels between different populations.
- Scatter plots, to analyze relationships between different spot quantities or statistical measures, in particular to examine gel similarities or experimental variations.
|
|
 |
pI and MW Calibration
You can define isoelectric point (pI) and molecular weight (MW) markers so that Melanie can calculate theoretical pI and/or MW values for all spots. pI calibration can be simplified by using predefined or custom templates for immobilized pH gradient (IPG) strips. This increases accuracy of estimated pI data, especially for nonlinear IPG strips. |
| Melanie is based on 35+ years of image analysis experience at the SIB Swiss Institute of Bioinformatics where Melanie software is constantly improved and maintained in collaboration with Cytiva. Over the years, Melanie has been trusted and adopted by thousands of researchers in academia and industry.
The functionality of Melanie’s Classic or DIGE modules can easily be extended with the Melanie Coverage module, thus allowing HCP coverage analysis, without having to learn new software. |
Try Melanie
You can download a fully working version of Melanie here and try it out using the non-DIGE and DIGE tutorial images. Nevertheless, we also recommend you request a free online demonstration via our contact form. During the demo session, an application specialist will:
- Show the analysis workflow and introduce you to some of Melanie’s key functionality
- Offer recommendations and tips to get you started quickly with the software
- Advise you on image acquisition, experimental design and best practices, to help you achieve the most reliable and reproducible results possible
- Answer your questions about the software, and about the available product and licensing options
- Explain how you can obtain a trial license to evaluate Melanie with your own gel or blot images
Request a free online demonstration