During development and manufacturing of biopharmaceuticals, host cell protein (HCP) impurities must be carefully identified and monitored to guarantee patient safety and drug efficacy. Immunoassays such as enzyme-linked immunosorbent assays (ELISA) are the gold standard for HCP detection and measurement. However, to validate an HCP ELISA and ensure it is fit for its intended use, the polyclonal antibody mixture used in the assay must demonstrate broad reactivity against a wide range of potential HCPs that can occur during the production process of the specific biological drug. Here Melanie Coverage comes in handy.
This module of the Melanie software is designed to analyze coverage – the percentage of immunodetection that an antibody reagent offers for the total population of HCPs. It does this by comparing a 2D gel or blot image of proteins detected with an anti-HCP antibody (i.e., secondary image) against an image revealing all HCP antigen proteins (i.e., primary image).
HCP coverage analysis is used for:
- Development of analytical methods (choice and validation of immunoassay reagents)
- Selection and validation of the most appropriate generic HCP ELISA kit
- Bridging studies to support assay replacement (e.g. change from commercial assay to platform assay or process-specific assay)
- Generic assay revalidation for every new batch of reagent
- Process- and platform-specific assay revalidation after changes that could affect HCP composition
- Optimization of bioprocesses
| The primary and secondary images used for coverage assessments can be generated from a host of applications. Melanie Coverage supports all 2D-PAGE based practices: |
| Conventional 2D gel electrophoresis followed by 2D Western blotting |
2D differential in blot electrophoresis (2D-DIBE) |
Immunoaffinity chromatography (IAC) followed by 2D differential in gel electrophoresis (2D-DIGE) |
| Melanie supports all common detection agents, including fluorescence, chemiluminescence and colorimetric and functional group-specific stains. Similarly, all industry-standard image formats can be analyzed, including TIFF, GEL, MEL, IMG/INF, GSC and 1SC files. Melanie also opens DS files for automatic import of DIGE gels. |
Simple workflow
Melanie Coverage guides you through the image analysis process with a user-friendly step-by-step workflow, delivering quick results. With the control and validation tools dedicated to each analysis stage, you can feel confident that you accomplish the necessary steps and checks for the highest quality results.
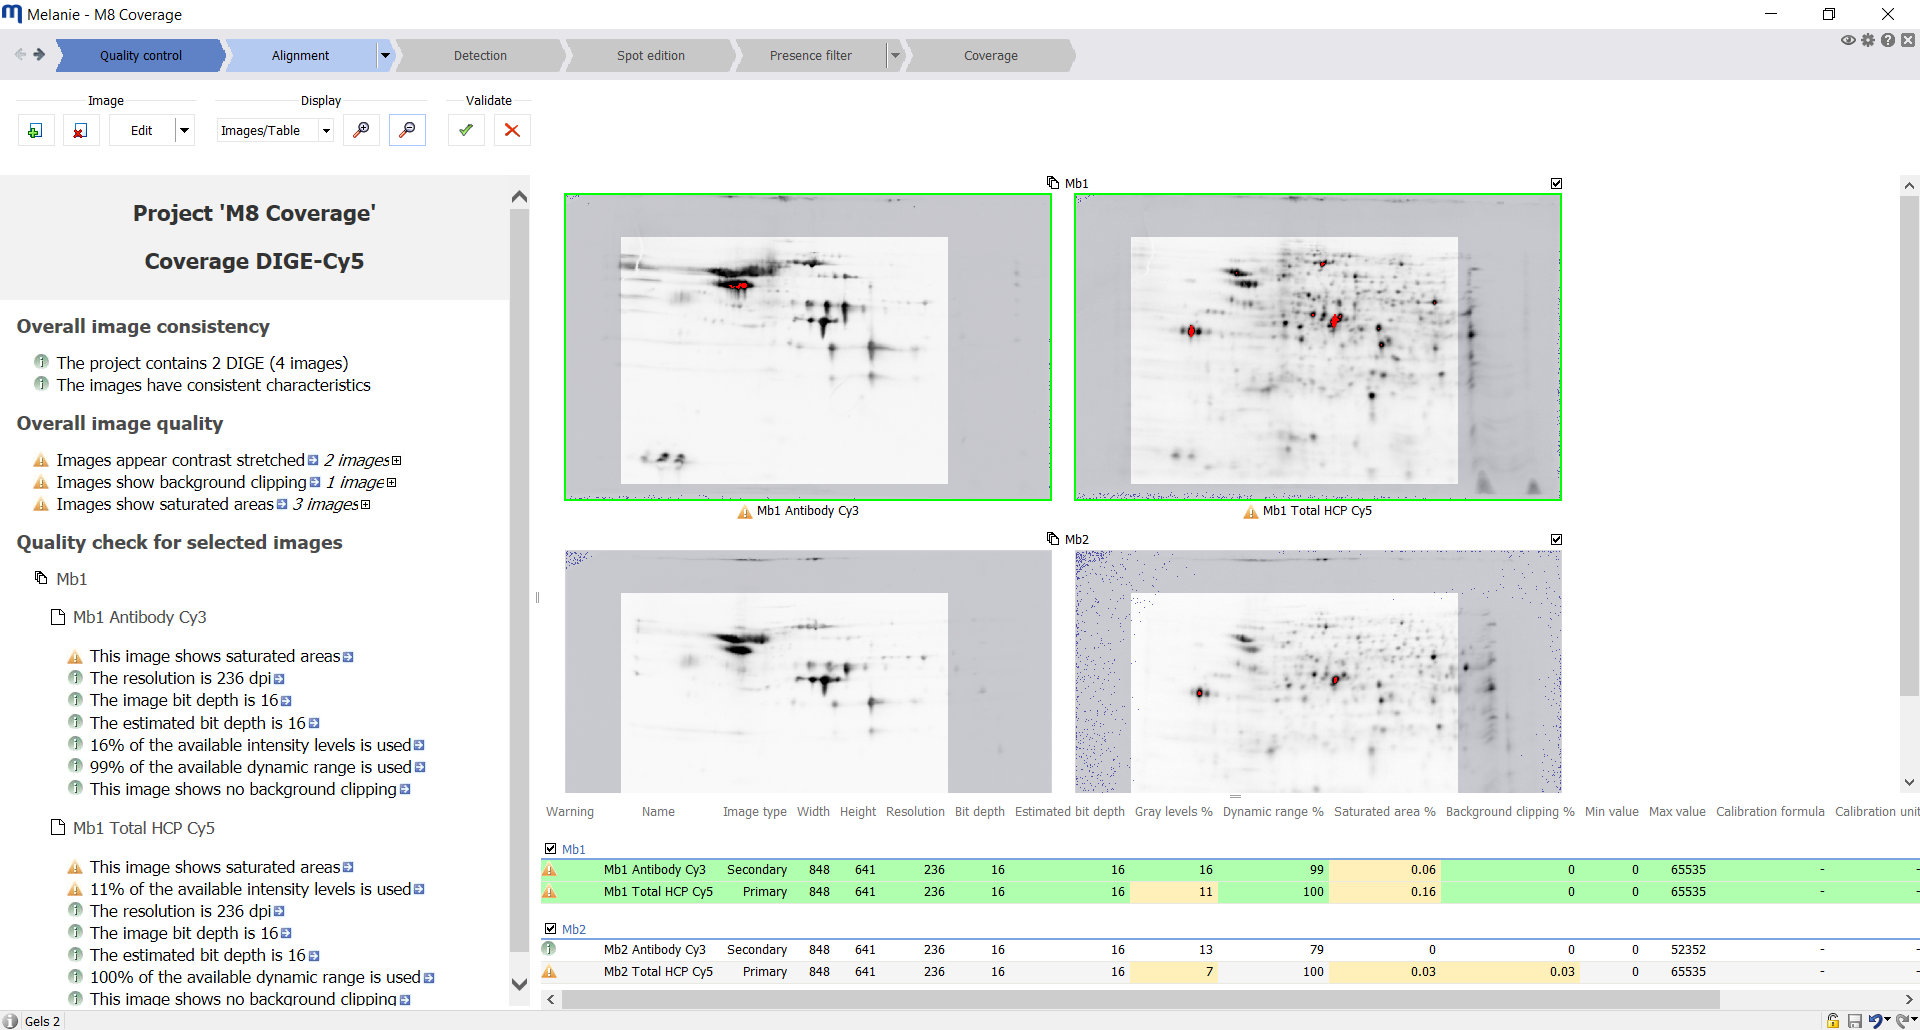
| Quality control
Check the quality and consistency of your images
Import images. Replicates of HCP-antigen/anti-HCP antibody image pairs can be analyzed as part of the same experiment. Verify Melanie’s automatic image quality feedback. This helps decide whether your gels or blots need to be re-scanned or edited. |
 |
|
|
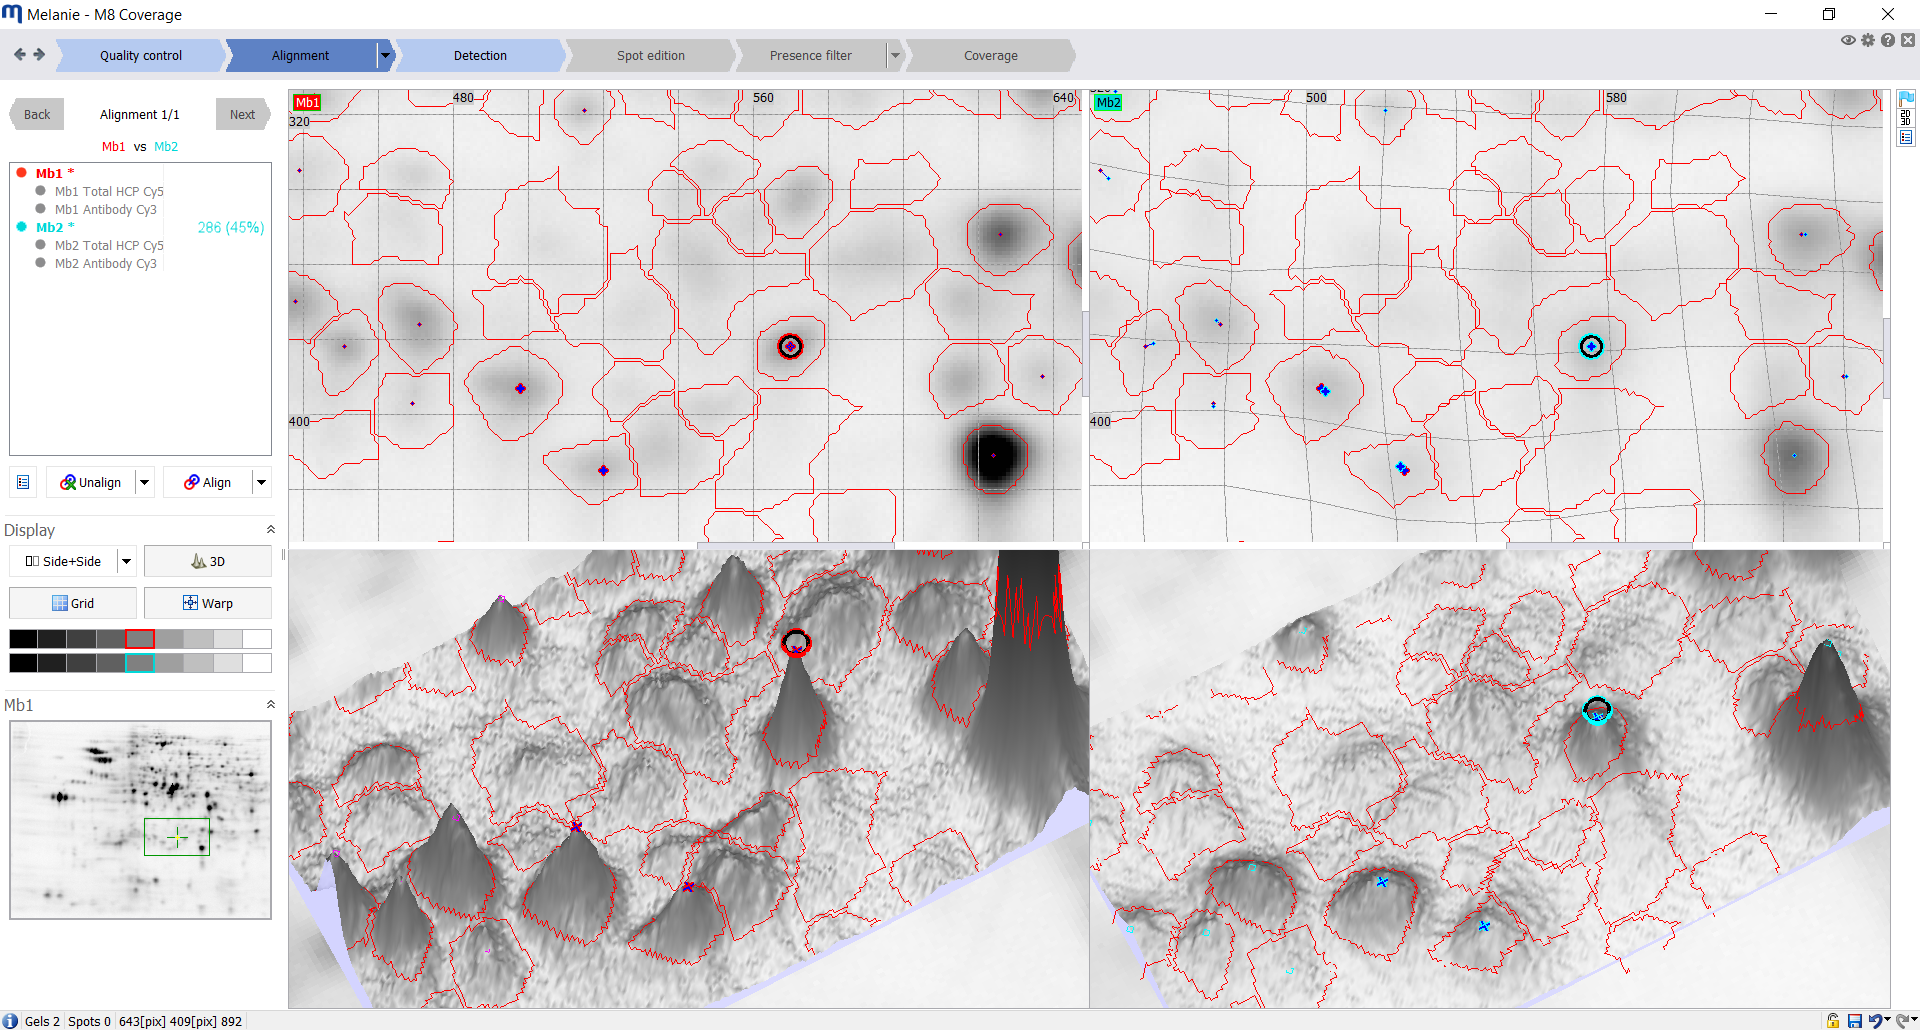
| Alignment
Align images to remove positional variation between gels
Align the images from different gels or blots using the automatic algorithm. Then systematically review each alignment pair using the dedicated tools and edit matches where necessary. |
 |
|
|
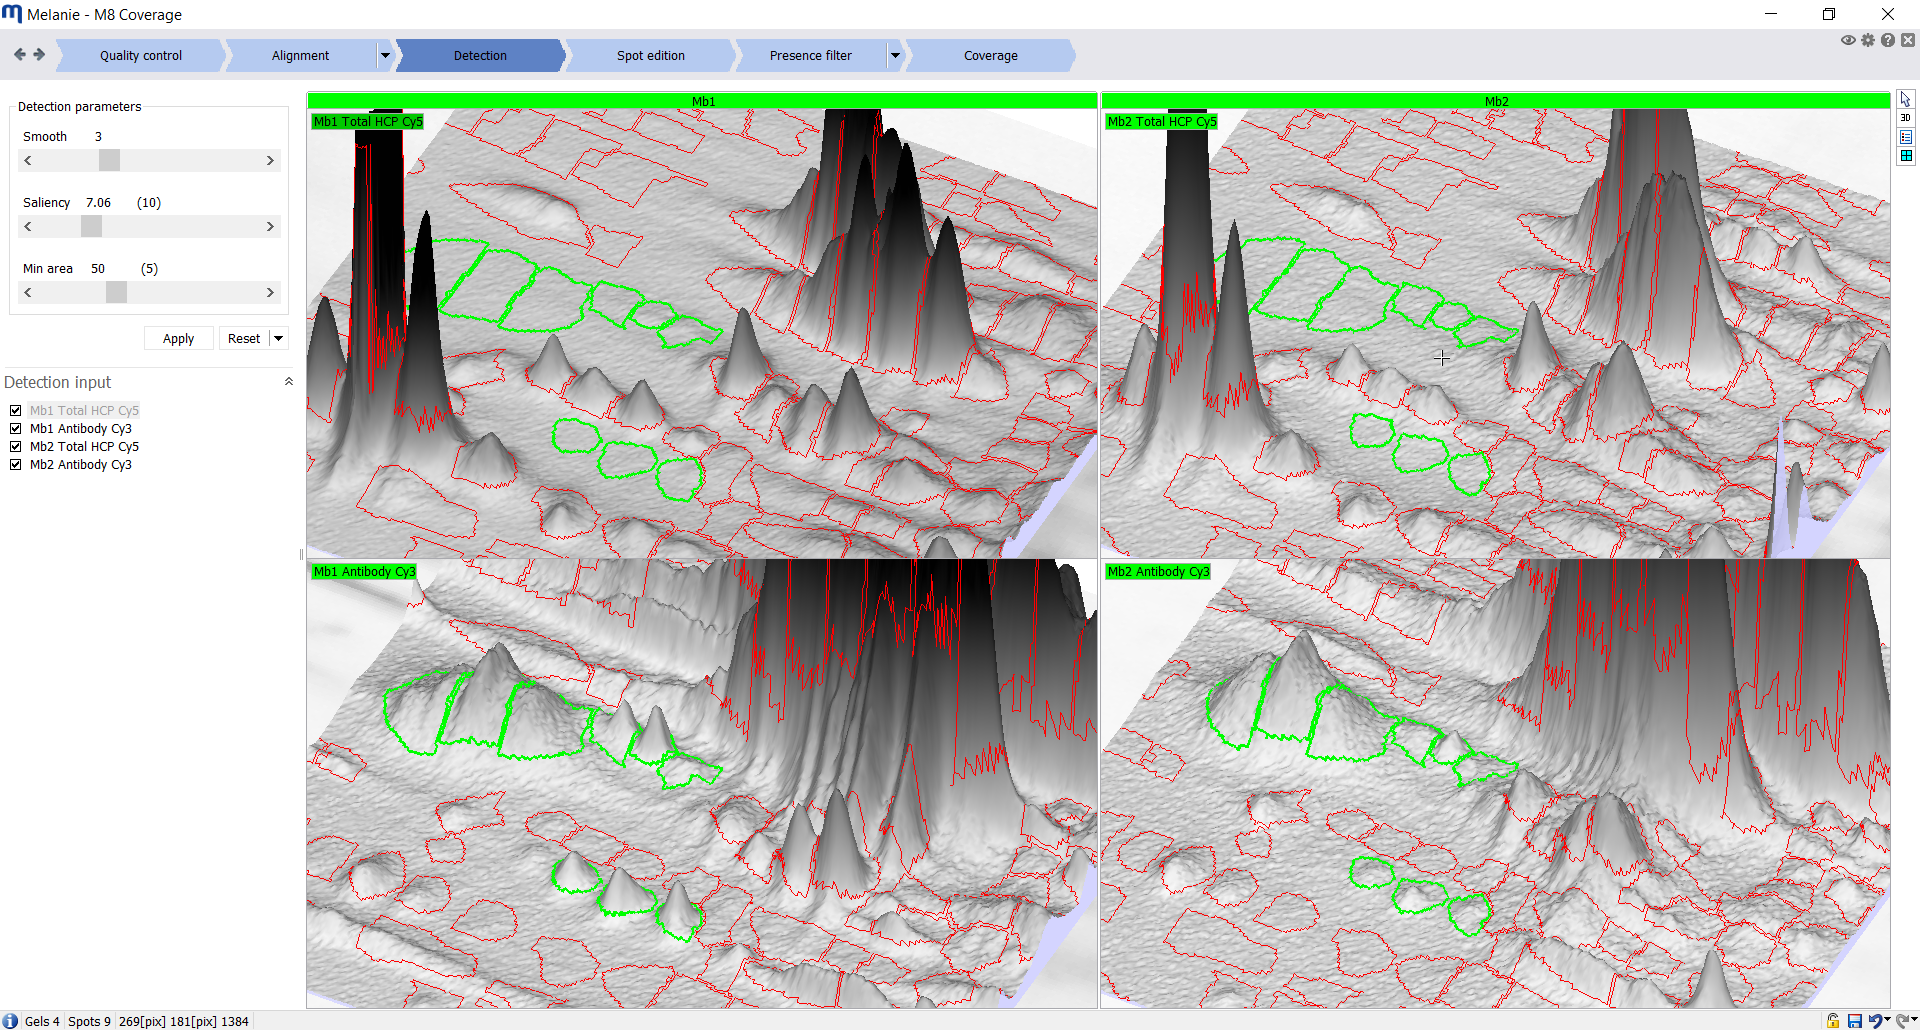
| Detection
Detect and quantify spots on all images
Fine-tune the detection parameters and select best images for the generation of the spot pattern. Either only HCP-antigen image(s) are used to determine the single spot map, or the anti-HCP antibody image(s) are included as well. |
 |
|
|
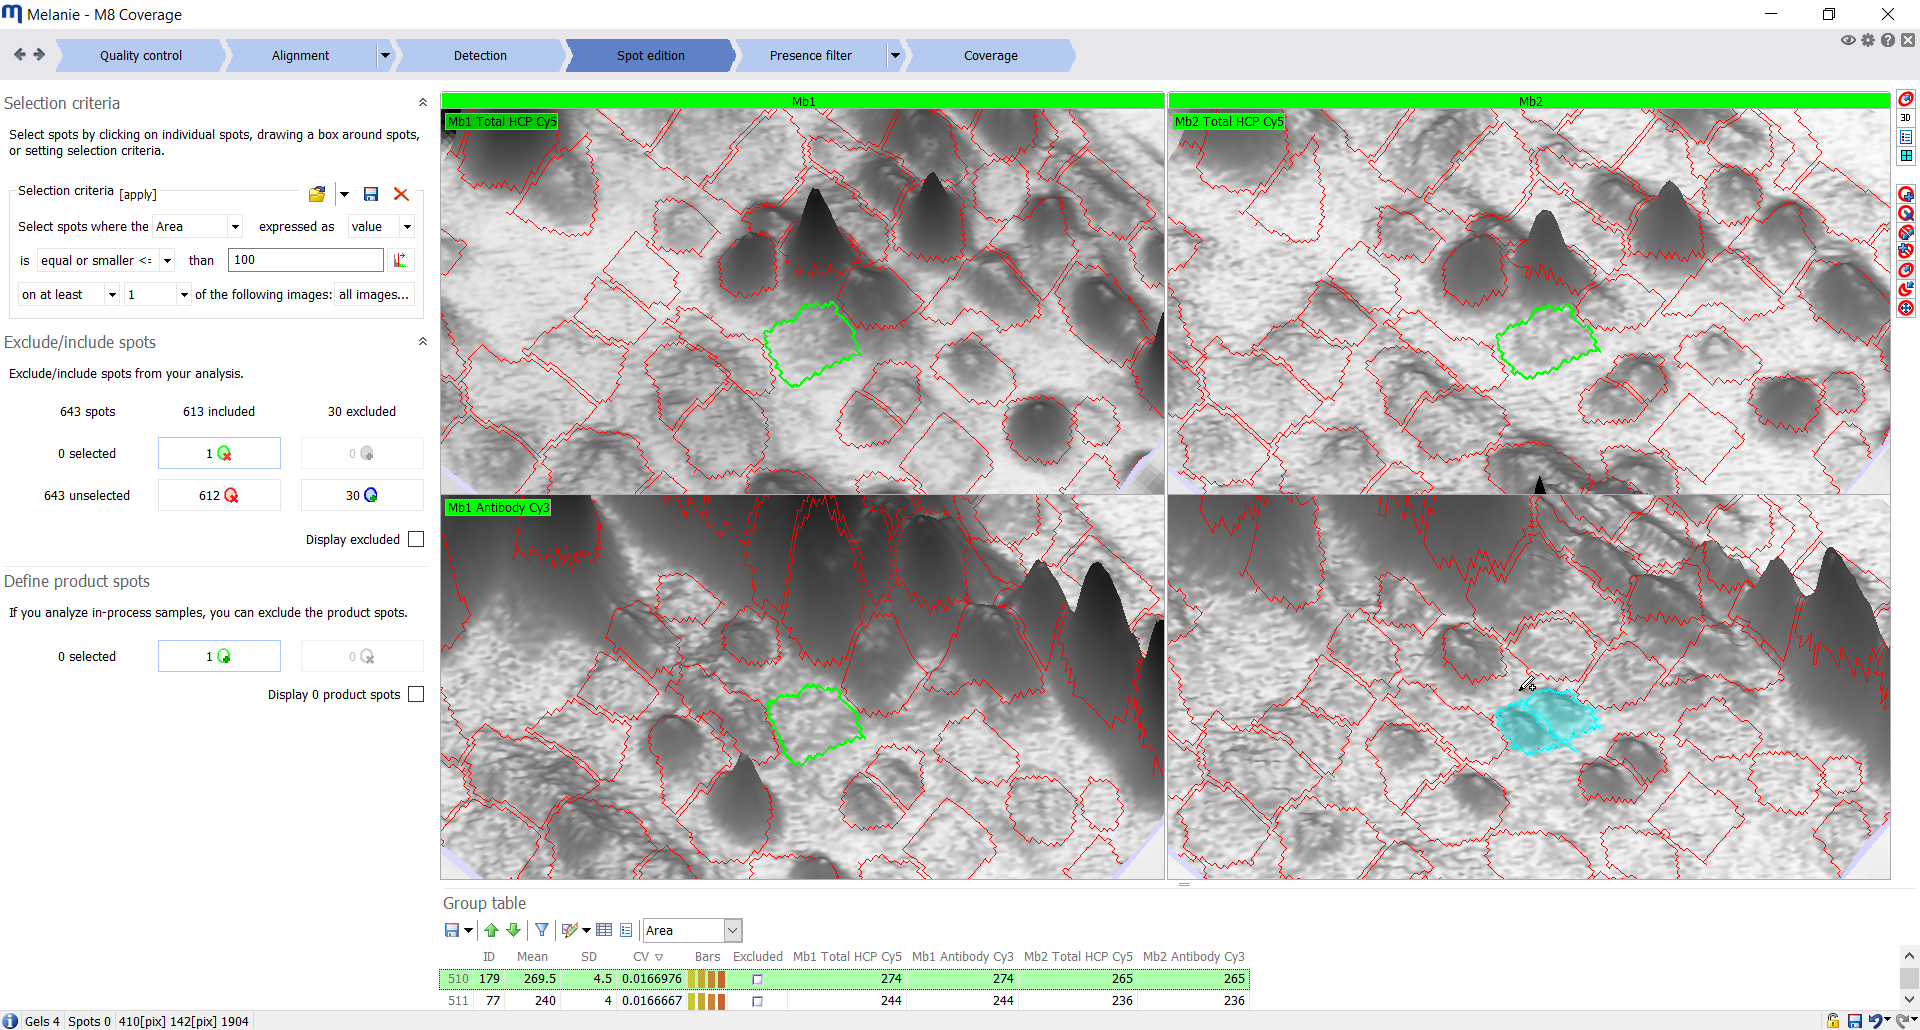
| Spot edition
Review and edit the spot pattern
Select spots either manually or based on advanced filter criteria, to include or exclude them from further analysis. Edit spots in the 2D or 3D views across all images to reduce bias. |
 |
|
|
| Presence filter
Filter spots on each image
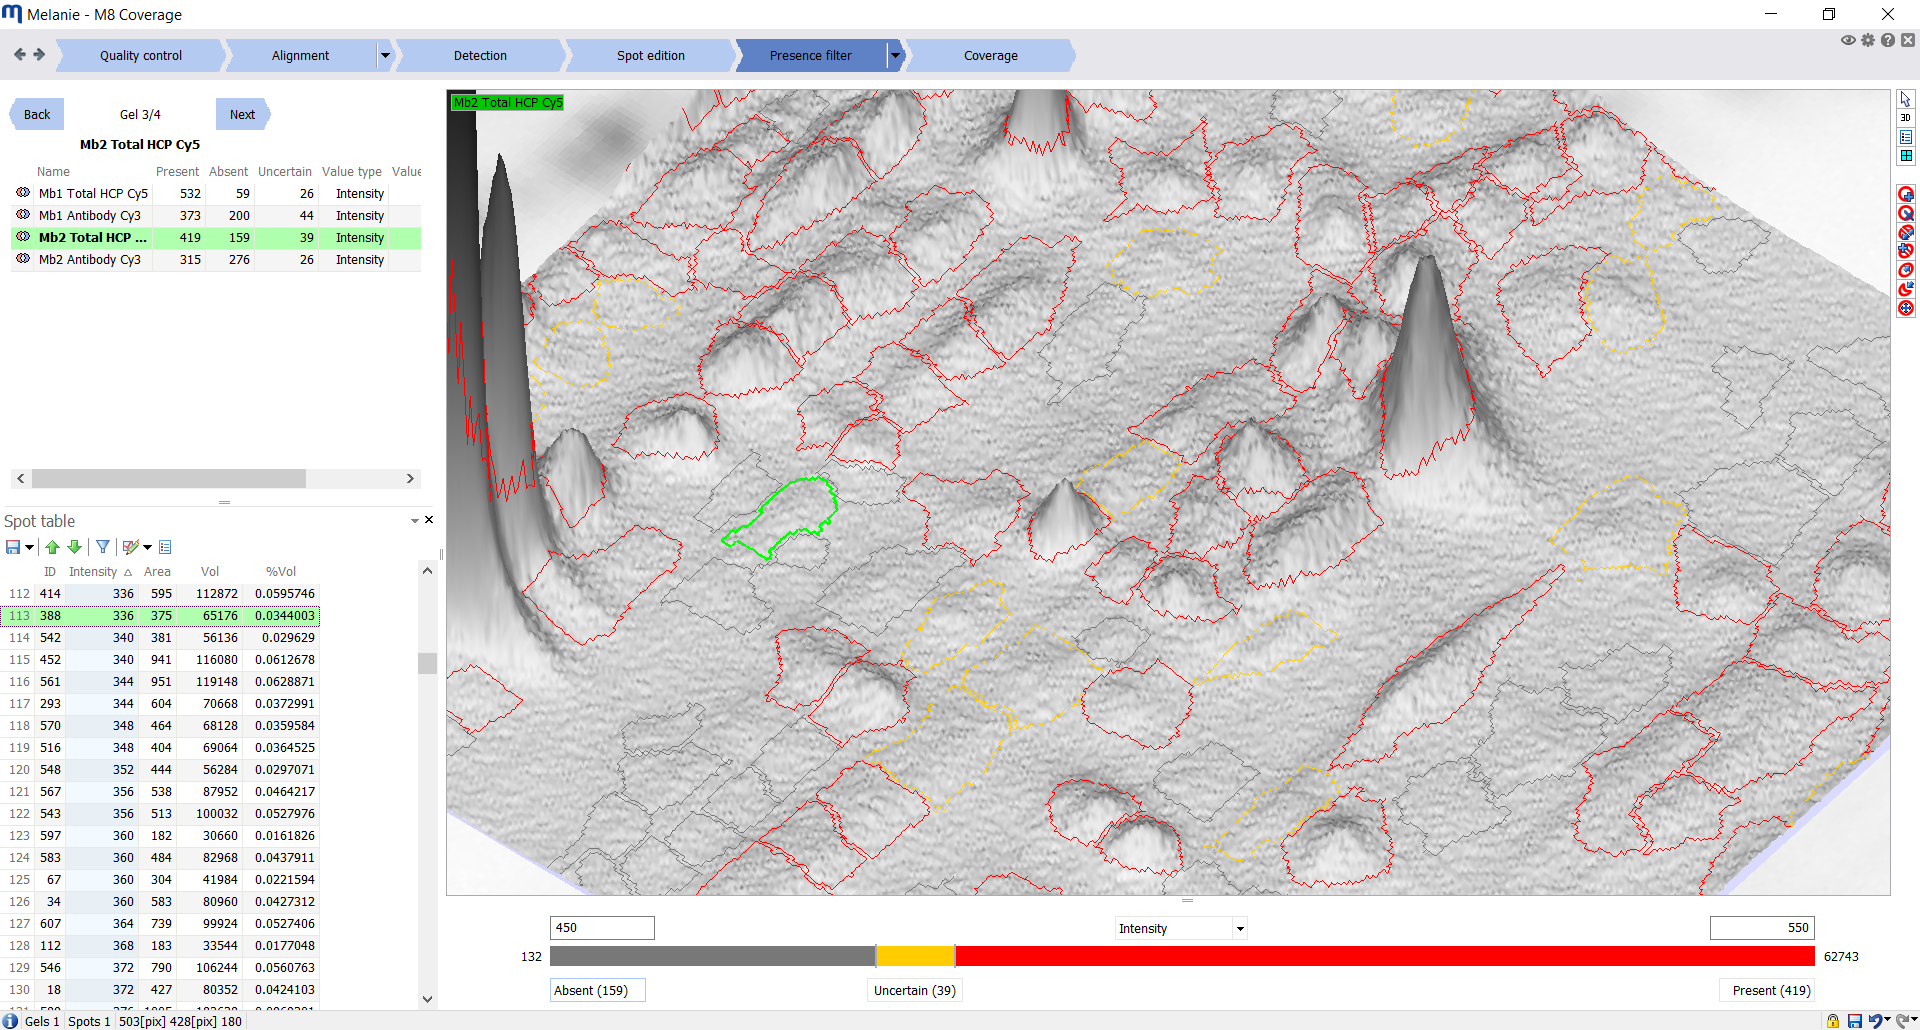
Filter spots on every image based on two abundance thresholds to categorize each spot as absent, present, or uncertain. Alternatively, the two thresholds can be set to the same value to classify each spot as either absent or present. |
 |
|
|
| Coverage
Explore and visualize percentage coverage
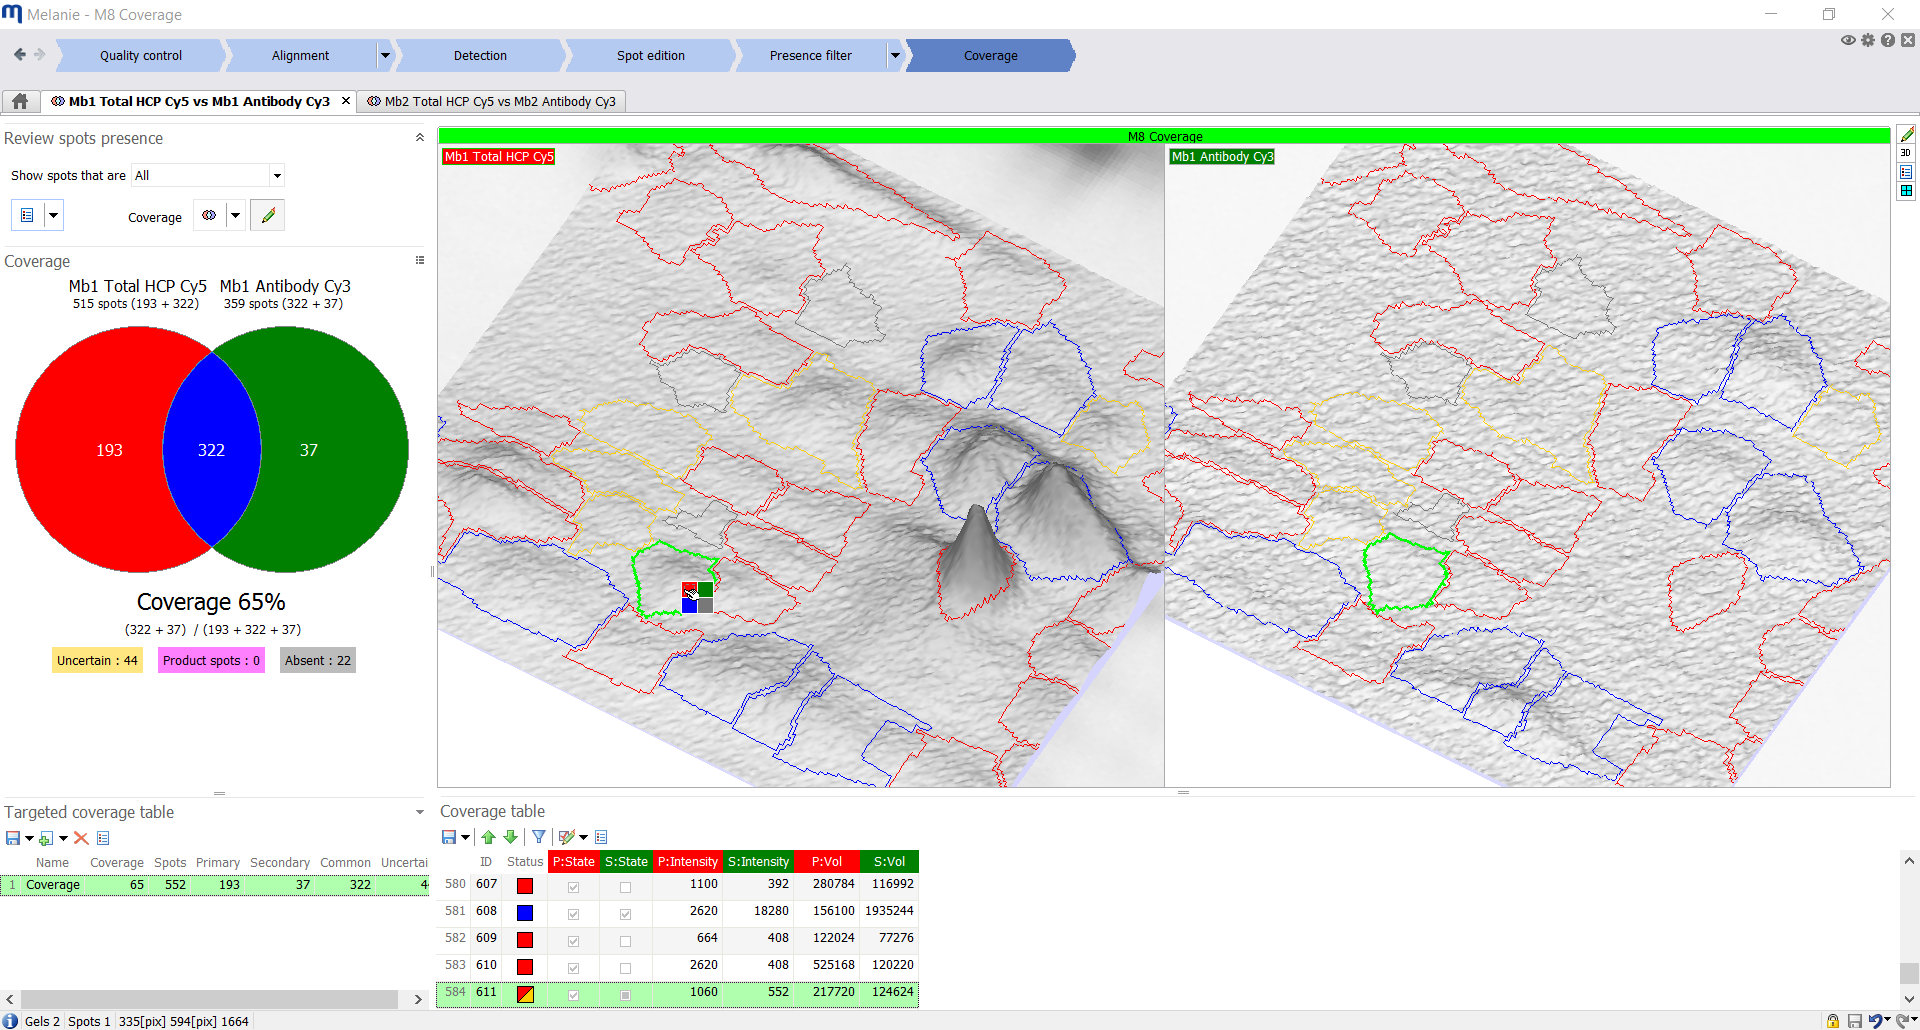
Easily review uncertain spots using the 3D view and table, and set their appropriate coverage with a single click. The percentage coverage and Venn diagram are instantly updated. When several image pairs are included, pair-wise comparisons can be chosen to be displayed in a summary table and histograms. Coverage can also be analyzed for a specific target area – for instance to compare coverage in the high molecular weight area of the images only. |
 |
Key benefits
 |
Achieve exceptional accuracy when comparing spots between images, for truly meaningful and dependable coverage results
- Get guidance on how to optimize image capture so your analysis isn’t compromised by sub-optimal image quality
- Precisely position matches during 3D assisted alignment editing
- Adjust detection parameters in 3D to ensure that even faint spots are detected
- Automatically detect all proteins, including those present only on the anti-HCP antibody image(s)
- Use the 3D view to set spot abundance thresholds to categorize spots as absent, present or uncertain
- Review and edit spot coverage status in 3D to make informed decisions about challenging features, such as streaks or spots that are faint, overlapping or saturated
|
 |
Improve productivity with time-saving features so you can swiftly move on to your next high value experiments
- Get started faster with the step-by-step workflow
- Reduce time spent on spot editing by including anti-HCP antibody images to generate the shared spot map
- Gauge the robustness of your assay with the coverage range and decide to continue the analysis or to perform further optimization
- Validate uncertain spots with one click
|
 |
Make your coverage analysis more reproducible and minimize user bias so you can feel confident about taking informed and objective decisions
- Analyze multiple HCP antigen and anti-HCP antibody images in a single experiment with a shared spot pattern for direct comparison
- Minimal need for manual spot editing
- Review spot edits using both 2D and 3D views across all images
- Avoid the subjectivity of spot status editing by simply reporting the coverage range, which is calculated based on the uncertain spots
|
 |
Favor data-driven insights and wow your team with an in-depth analysis and clear visual representations of your results
- Compare coverage between image quadrants by selecting spots based on estimated pI and MW values
- Relate coverage results for different replicates, cell lines, antigens or antibodies in a single project
- Observe variations in immunodetection at the single protein level – between replicate blots, different antibody reagents or various antigens
- Click a colored area in your preferred diagram to select the corresponding spots on the images and in the coverage table
- Select one of three formulas for each of the three coverage types, to calculate coverage for any desired image pair (primary vs. secondary, primary vs. primary, secondary vs. secondary images)
|
 |
Be ready for regulatory submissions with flexible data export options, so you can build a strong dossier to submit to health authorities such as FDA and EMA
- Automatically generate a comprehensive PDF report of your entire analysis, summarizing all essential quality control checks, analysis parameters, results, images, tables and plots in a single document. A detailed spot measurements report can be generated as a referenced appendix
- Easily visualize and export critical analysis parameters such as position of alignment vectors, spots that were excluded or edited, and thresholds used for categorization of spots
- Save, print or copy to clipboard all project data, tables and images (2D and 3D views, graphical reports, Display area, Application window)
|
Feature focus
|
Image quality control
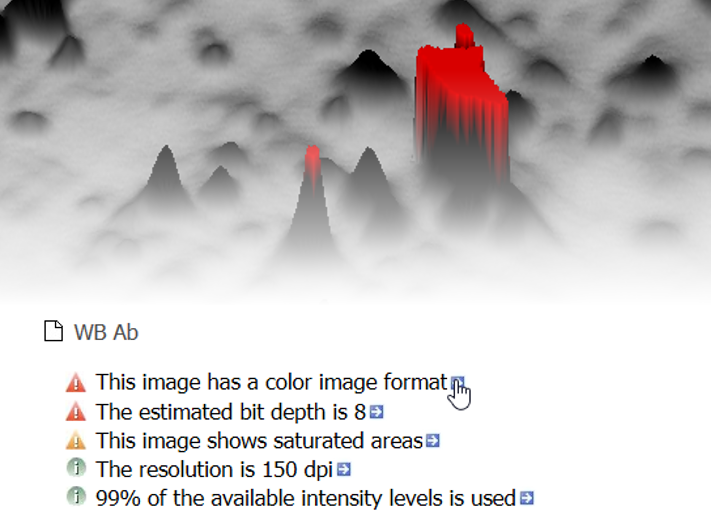
Melanie automatically controls the quality of your images so that you get the necessary feedback to optimize your image capture procedures. It also checks that all images in the data set have consistent characteristics such as size or intensity encoding. Potential issues are highlighted and information provided on how to solve them.
This quality control step will save the time that would otherwise be required to analyze images with only limited potential to deliver relevant results. |
| Alignment
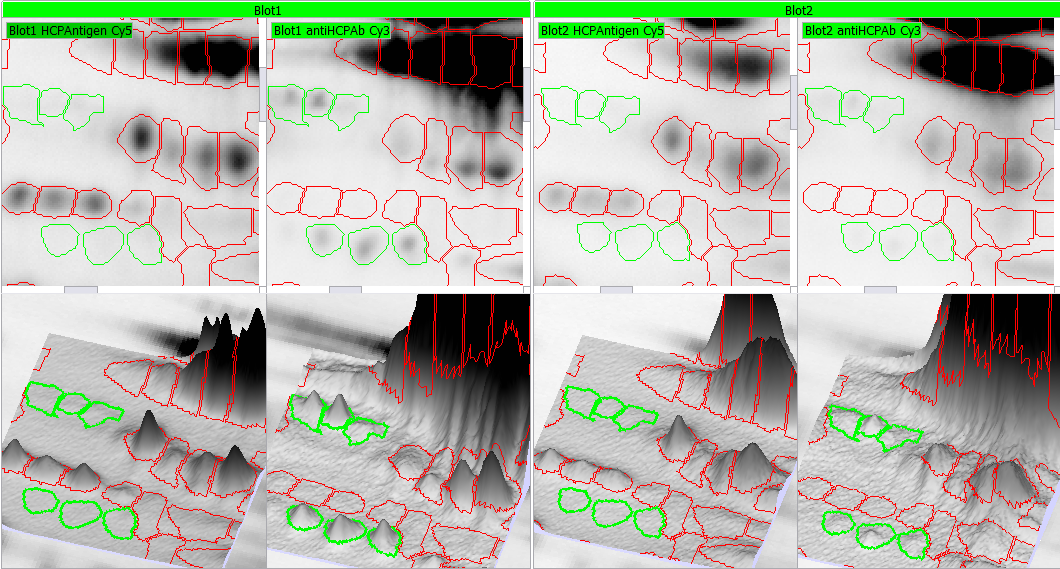
Alignment – removing the positional variation inherent to electrophoresis – is the most critical step in coverage analysis. When juxtaposing images from different physical objects, alignment is essential, as improper alignment could lead to misinterpretation of the data. For experiments that use DIGE or DIBE, intra-gel or intra-blot alignment is not needed (although it can be activated to correct for dye-shifts that can occur in low molecular weight regions).
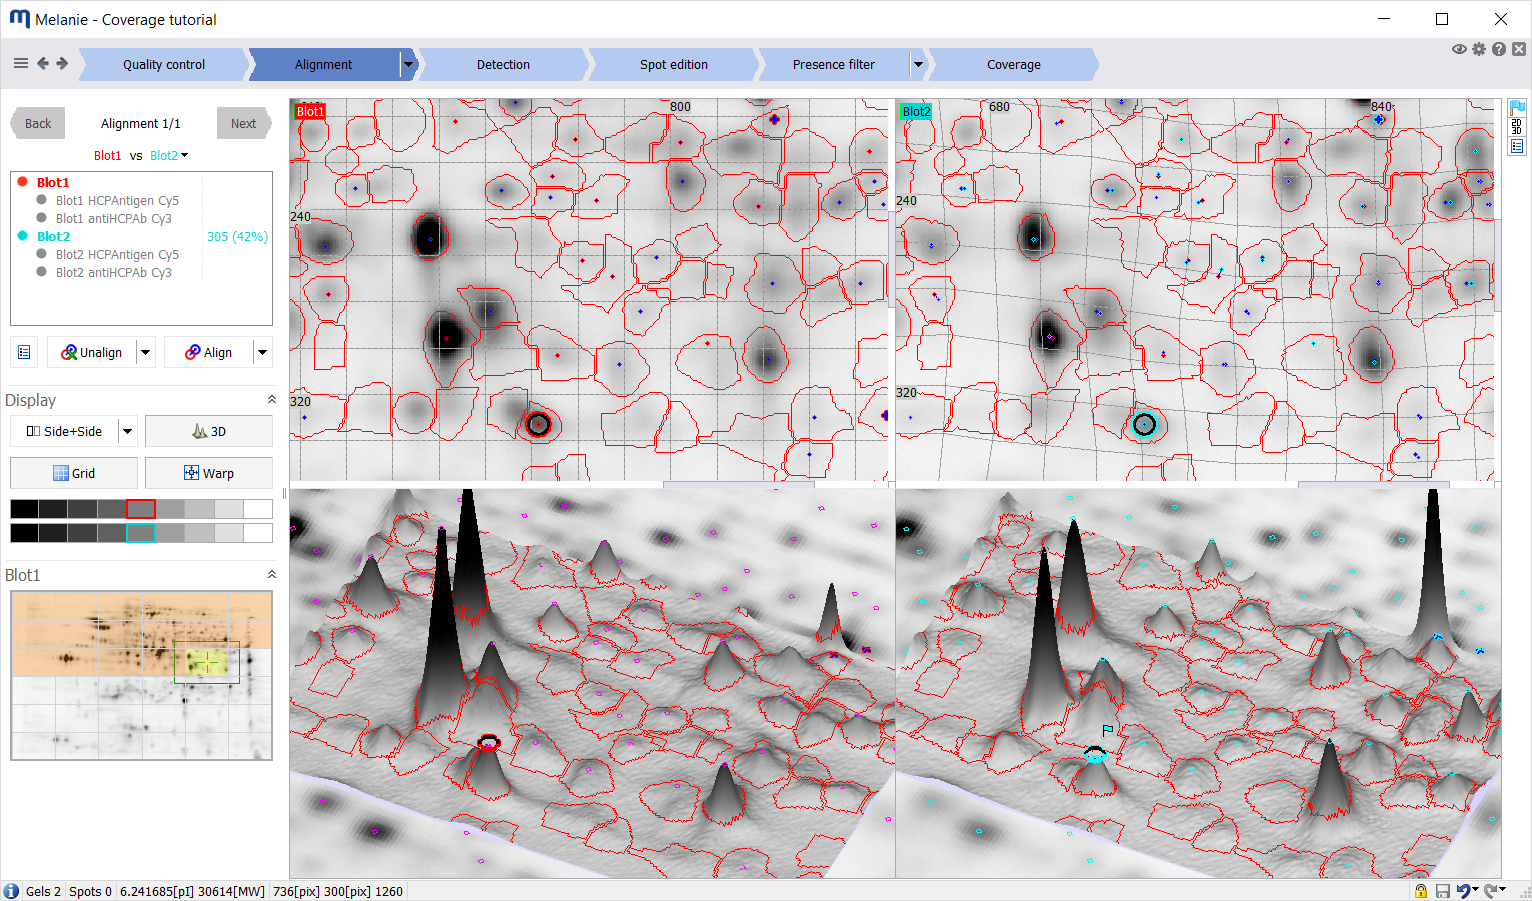
Alignment is accomplished by finding spot matches between an image in the experiment and its reference image, and then warping the image so that its spots precisely superimpose with those of the reference image. While the Melanie matching algorithm automatically pairs corresponding spots, you can manually edit matches where necessary. Alignment editing views and tools let you work in the way that is most efficient for you:
- Select your preferred display option during alignment (side-by side, dual color, blink)
- View warped or original images
- Display a grid to visualize deformations in aligned gels
- Edit matches in 3D during alignment review, for exceptional alignment accuracy
|
 |
|
Detection and spot edition
Once all images are aligned, Melanie Coverage detects spots on a composite image and propagates the spot boundaries to all images in the experiment. As a result, you will have virtually identical spot patterns on every gel and 100% spot matching, simplifying subsequent review of spot presence status. Either only HCP-antigen image(s) are used to determine the single spot map, or the anti-HCP antibody image(s) are included as well.
You can remove irrelevant spots from further analysis by selecting them either manually or based on advanced filter criteria and then excluding them. Where required, you can add spots and split, merge, grow, shrink or move spots. These spot edits are performed on all images simultaneously, maintaining 100% spot matching throughout the data set and preserving data integrity.
|
| Presence filter
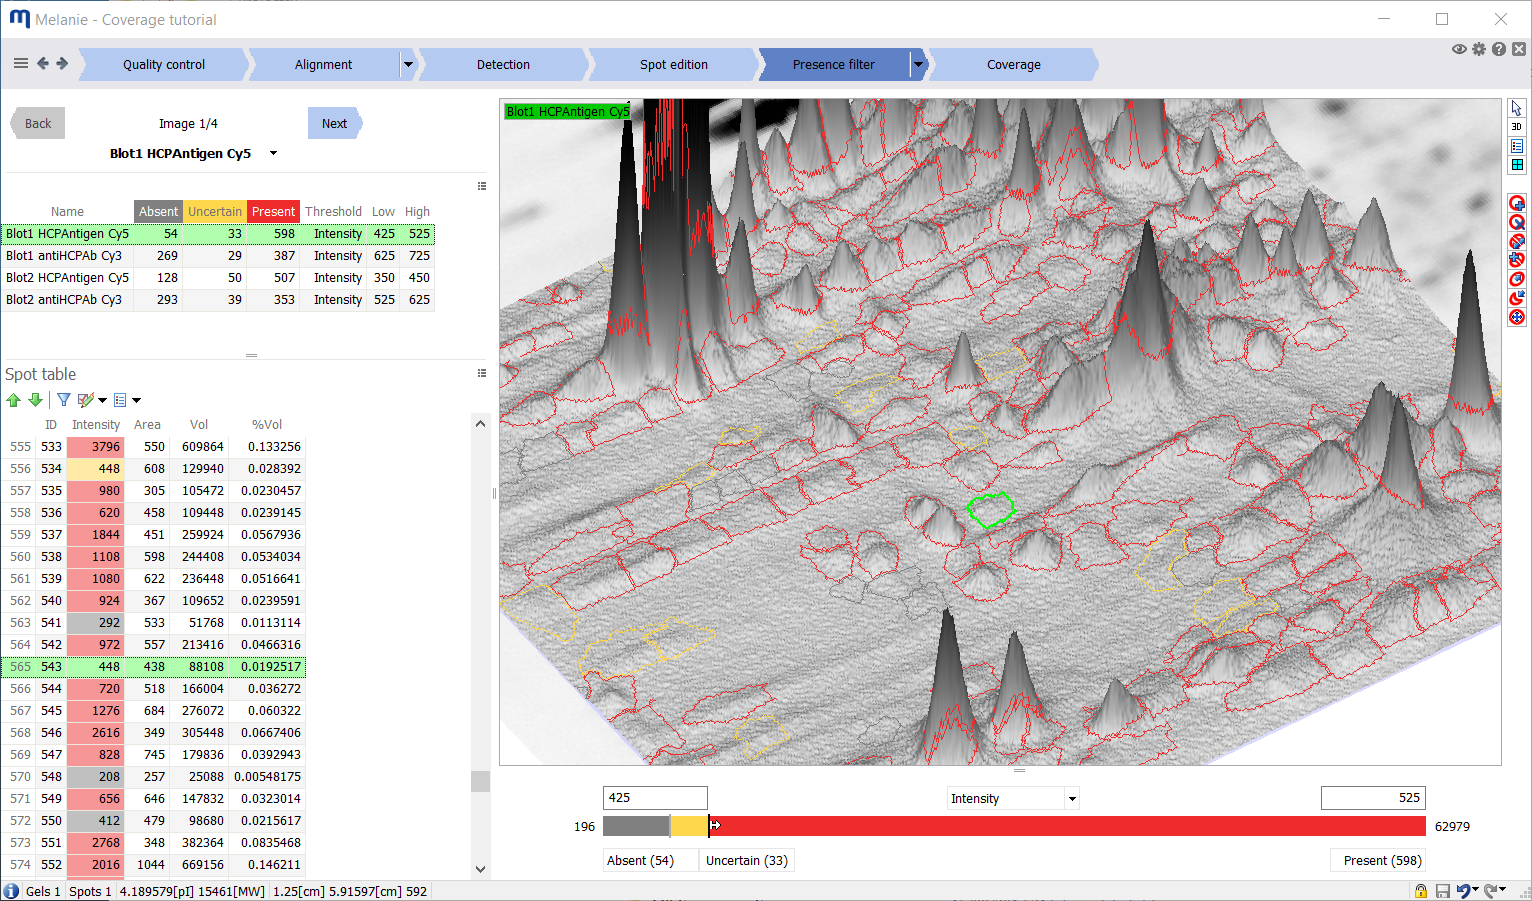
Categorization of spots as absent or present is based on a spot-abundance threshold. While it may be easy to fix a value below which you consider a spot as absent, and there likely is a limit above which you confidently regard spots as present, there often is a gray zone. Between the two thresholds, you may want to treat some spots as absent and others as present, depending on factors such as shape, size and position. These could indicate that the spot is an artifact, that its abundance is overestimated due to overlap with a neighboring spot, or that its abundance is underestimated due to saturation.
- Melanie Coverage provides for two user-determined thresholds to categorize spots as absent, present or uncertain. Only the uncertain spots will require manual review, resulting in significant time savings
- The two thresholds can be set to the same value to tag spots as absent or present, without any uncertain spots
- Filter thresholds may be set for each individual image to accommodate variation in dynamic ranges of the images
|
 |
 |
Coverage and coverage range
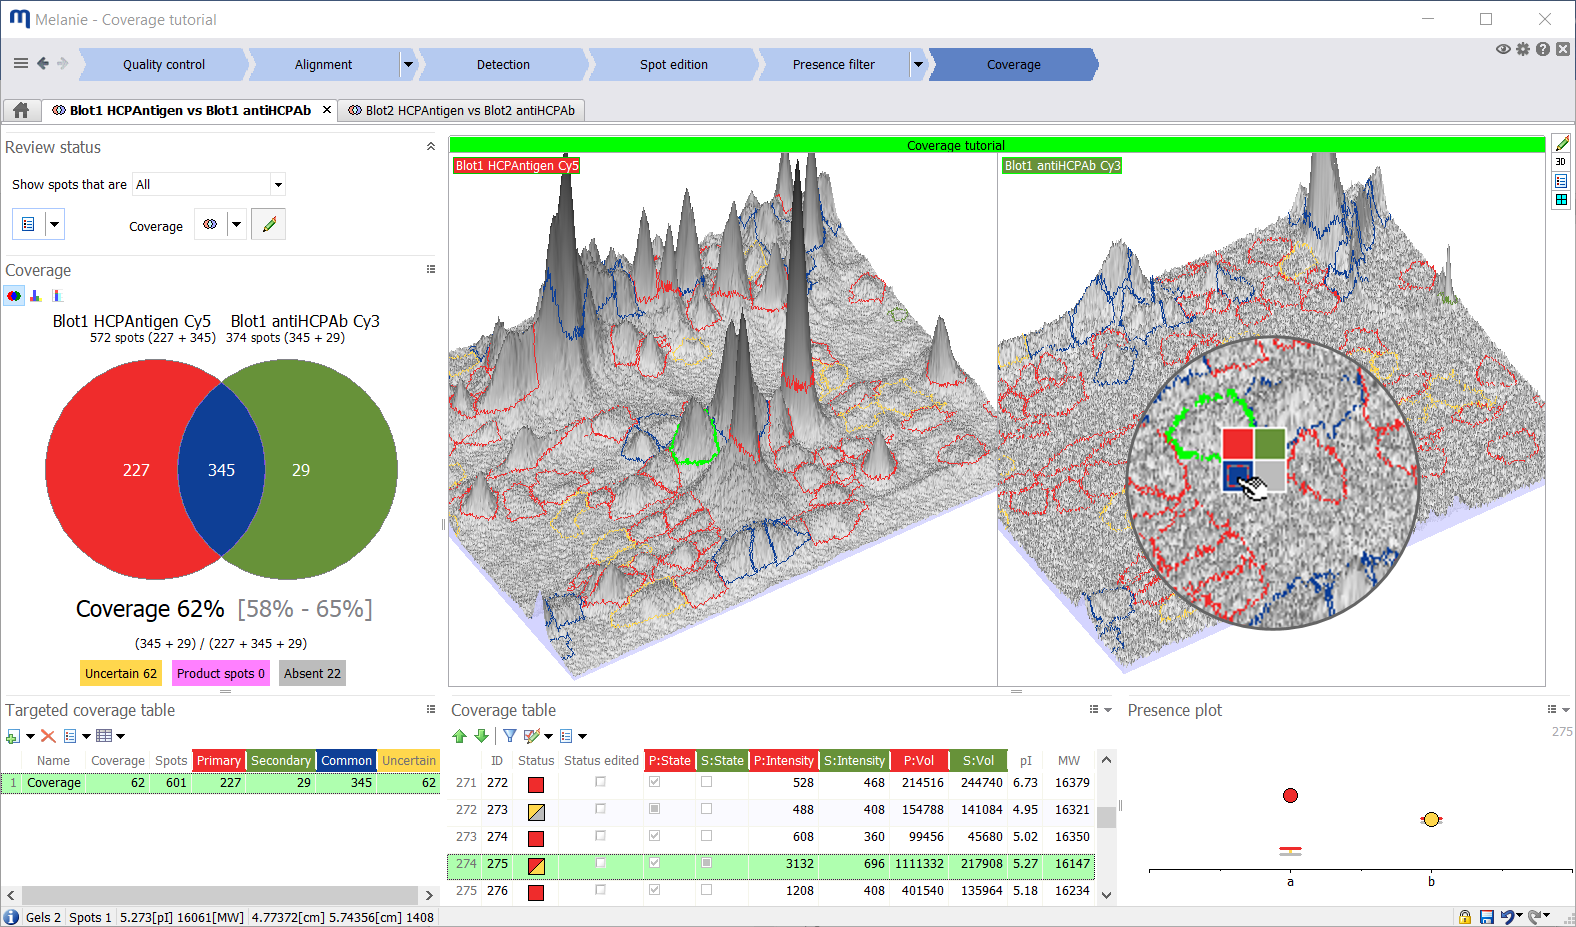
For each image pair, Melanie determines the coverage status of every spot based on whether the spots in the two images were tagged as absent, present or uncertain after filtering. Each spot pair will have one of the following coverage statuses:
- Absent: absent from both images
- Common: present on both images
- Primary: only present on primary image
- Secondary: only present on secondary image
- Uncertain: uncertain on one or both images
Percentage coverage will be calculated based on the number of common, primary and secondary spots, according to one of three possible formulas.
To obtain a definitive number for the percentage coverage, uncertain spot pairs must be reviewed and assigned a final coverage status. This process is streamlined with the ability to inspect the spots in 3D and define their status with a single click in the images or table.
To avoid the subjectivity of spot status editing, integrate the notion of uncertainty in your results or simply save time, you can report the coverage range instead of the coverage. The coverage range encompasses the values that the coverage could take, assuming you only edit the spots with uncertain state. |
| Quadrant analysis
In addition to the default coverage for all spots, the software can calculate coverage for given targets, i.e., subsets of spots. For instance, to evaluate the performance of your ELISA antibody reagent to recognize different charge and size categories of proteins – notably the least immunogenic low molecular weight HCPs, you can create coverage quadrants by specifying pI and MW thresholds. You will instantly see in which pI and MW ranges the antibody coverage is suboptimal and where further optimization of immunization strategies is needed.
Since coverage range is assessed for individual quadrants, you will know where to best start reviewing uncertain spots to quickly refine your coverage percentage; just select the quadrant with the largest coverage range, displayed as a black vertical interval in the quadrant histograms. |
 |
 |
Visual coverage summaries
Coverage analysis is typically carried out on replicate gels and/or blots to estimate the reproducibility of the experiments. Melanie Coverage allows you not only to analyze multiple HCP antigen and anti-HCP antibody images as part of the same experiment, but also to visually summarize all their coverage information.
Furthermore, your analysis can extend beyond the default HCP-antigen / anti-HCP antibody image pairs. Coverage can be calculated for any desired image pair, even from two separate blots. And as a different coverage formula can be used for each of the three coverage types (primary/secondary, primary/primary, secondary/secondary), you can instantly measure the similarity between two primary images or two secondary images with the Jaccard similarity coefficient.
In addition, you can show the coverage summary either for the total coverage, including all spots, or just for one of the quadrants. |
| Spot presence review across all images
You may have run replicate blots to check how reproducible they are. Maybe you want to compare immunoreactivity of various antibody reagents against the same antigen, or the same antibody against different antigens. For this kind of analysis, it becomes instrumental to go beyond a simple coverage percentage and to zoom in on the presence of individual proteins across all images, to look at and understand variations in immunodetection.
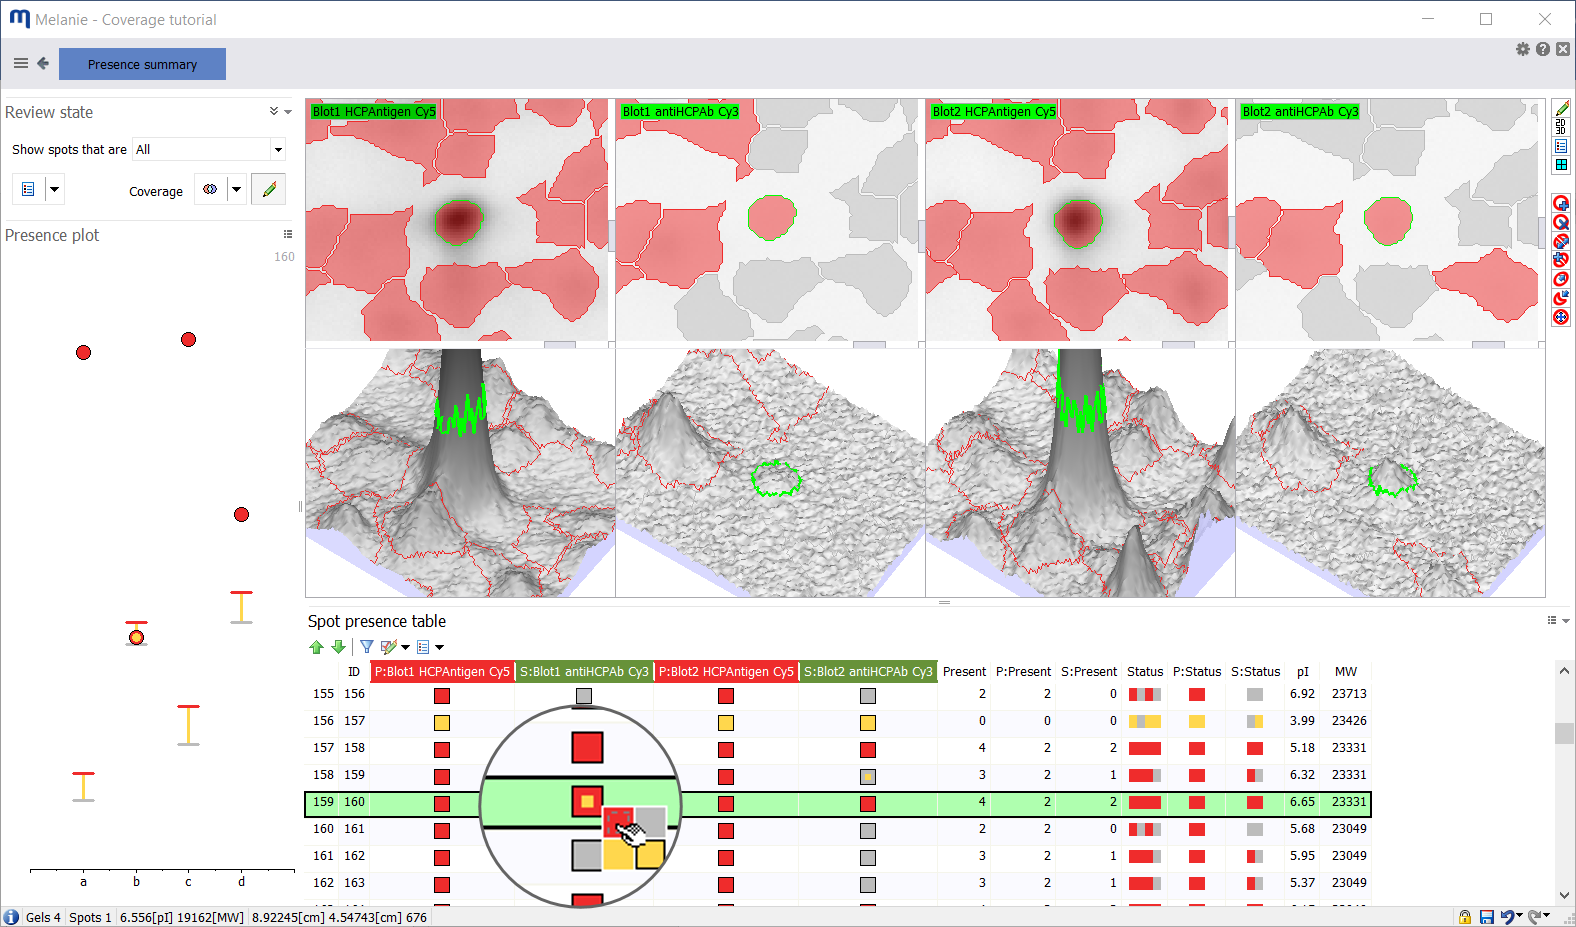
The presence summary helps you with that. It summarizes the absence/presence of each spot on every image in the experiment to let you:
- Review uncertain spots and edit their presence state while visualizing the spot on all images
- Identify spots for which the presence state was edited
- Verify if modifications of spot presence state are congruent with the presence filter thresholds using the presence plot. The latter shows where the abundance value of a spot is situated relative to the presence filter thresholds and therefore whether your edits seem reasonable
- Select proteins that were detected with a certain frequency in specific image subsets (e.g., all, primary, or secondary images)
- Select proteins with specific expression profiles. This enables you to compare how and where different anti-HCP antibodies vary in terms of HCP recognition or to tell what proteins are similar or different between HCP antigens
|
 |
| Melanie Coverage is based on 35+ years of image analysis experience at the SIB Swiss Institute of Bioinformatics where Melanie software is constantly improved and maintained in collaboration with Cytiva. Over the years, Melanie has been trusted and adopted by thousands of researchers in academia and industry.
The Melanie Coverage module springs from collaborations and feedback from major biopharmaceutical and biotechnology companies as well as bioassay developers. It is entirely and solely focused on HCP antibody coverage analysis, with a specific workflow and dedicated tools. Its functionality can easily be extended with the Melanie Classic or Melanie DIGE modules, thus allowing differential protein expression analysis, without having to learn new software. |
Try Melanie
You can download a fully working version of Melanie here and try it out using the tutorial images. Nevertheless, we also recommend you request a free online demonstration via our contact form. During the demo session, an application specialist will:
- Show the analysis workflow and introduce you to some of Melanie’s key functionality
- Offer recommendations and tips to get you started quickly with the software
- Advise you on image acquisition, experimental design and best practices, to help you achieve the most reliable and reproducible results possible
- Answer your questions about the software, and about the available product and licensing options
- Explain how you can obtain a trial license to evaluate Melanie with your own gel or blot images
Request a free online demonstration


