The case for analyzing images from multiple gels/blots in a single coverage project
Introduction
In the context of selecting or developing antibody reagents for HCP ELISA assays, multiple coverage analyses become essential to compare various experimental factors, including replicates, cell lines, process parameters, antigens, antibodies, and more. A critical question arises: Is there merit in analyzing image pairs from such comparisons individually, as is often the practice, or should these images be collectively analyzed in a single project? Overwhelmingly, the evidence leans toward the latter. In this discussion, we delve into why this integrated approach is not only convenient but an essential methodology for accurate, efficient, and comprehensive analysis.
Disclaimer
It is important to recognize that integrating images from multiple gel and/or blot pairs in a single project does require alignment work to find spot correspondences between different physical objects. While this might seem like additional effort, when applying reproducible methods and following our alignment guidelines, the advantages substantially outweigh this extra step.
Benefits of an integrated approach
Efficient comparisons
A unified project analysis
Consider this scenario for a DIBE experiment in which two blots – so two image pairs – were generated; the images B1Ag and B1Ab were acquired from Blot1, while B2Ag and B2Ab represent the antigen and antibody images from Blot2. By evaluating them within a single project, you can compare six image pairs (e.g., B1Ag-B1Ab, B2Ag-B2Ab, B1Ag-B2Ag, B1Ab-B2Ab, B1Ag-B2Ab, B2Ag-B1Ab), notably allowing similarity analysis of the antigen images and the antibody images. It’s like getting six for the price of two!

Challenges with separate projects
On the flip side, if these two image pairs are analyzed in distinct projects, four of the comparisons are impossible (B1Ag-B2Ag, B1Ab-B2Ab, B1Ag-B2Ab, B2Ag-B1Ab). Or you’ll find yourself embroiled in creating more projects, ultimately resulting in extra alignment tasks and more complexity.
Single entry of project properties
An integrated approach saves time by requiring the entry of project properties only once, which may include details of methods, materials, conditions, or notes about the methodology or results of the analysis. While entering such information is optional, we think it is good practice to help your colleagues, and future self, understand and remember the context of the project.
Quality and consistency
Distinguishing variations in image quality
Analyzing images in the same project makes it easier to notice variations in gel and image quality. If ignored, these differences can lead to inconsistencies and unreliable results. By viewing all images collectively, these differences become apparent and can be accounted for.
Consistent cropping & selection of region of interest
By working within a single project, choosing the same cropping area and region of interest becomes considerably simpler. This ensures that what’s being compared remains consistent across the board. In practice, this means you’re always comparing apples to apples, not apples to oranges.
Enhanced detection quality
By integrating image intensity information from different gels or blots for the generation of the consensus image, the quality of detection can be improved. Moreover, results will be more consistent when applying the same detection pattern to all images.
Leveraging the best resolved MW markers
If you include molecular weight (MW) markers on the side of each gel, you can choose the gel with the best resolved markers for MW calibration, thereby enhancing the precision of MW estimates.
Depth in analysis, comparison and presentation
Standardized spot outlines & coordinate space
Analyzing each image pair separately can lead to inconsistencies in the number of detected spots and their spot outlines. With the integrated approach, the spot outlines on all images are virtually identical and in the same coordinate space. Comparisons will therefore be much easier and reliable.
Comparison at the protein level
When image pairs are analyzed separately, you can only compare their overall coverage percentages. You lose the ability to compare differences at the protein level. This limits the depth of understanding you can gain from the results.
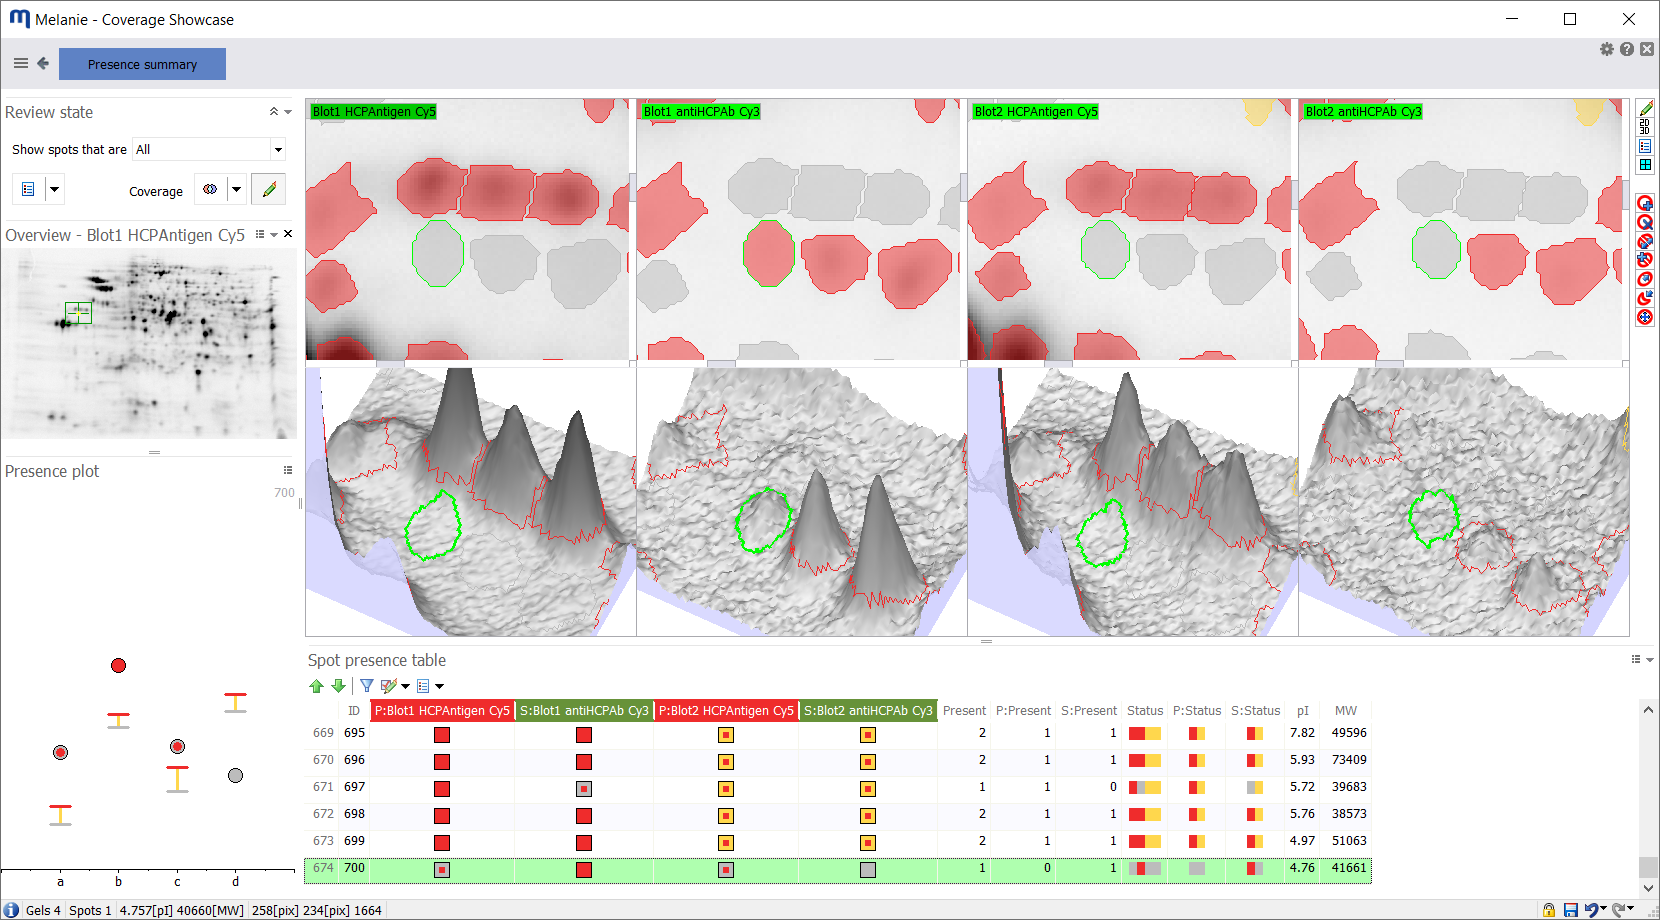
With an integrated approach, you can use Melanie’s Presence summary to compare the presence state for individual proteins across blots or gels. It summarizes the absence/presence of each spot on every image in the experiment, allowing you to:
- Select proteins that were detected with a certain frequency in specific image subsets (such as all images, primary images or secondary images).
- Select proteins with specific expression profiles. This enables you to compare how and where different anti-HCP antibodies vary in terms of HCP recognition or to tell what proteins are similar or different between HCP antigens.
- Edit spot coverage status while viewing the spot on all images.
- Identify for which spots the coverage status was edited.
Uniformity in Image Presentation
For those looking to present their findings, integrating your analysis means you can view and export images warped to the same coordinate space. This makes them easier to compare and more presentable for conferences, reports, publications or regulatory submissions.
Conclusion
Opting to incorporate images from multiple gels/blots into one analysis project isn’t merely a matter of preference. It’s an indispensable strategy to achieve a nuanced understanding of HCP recognition. By facilitating efficient comparisons, enhancing quality, ensuring uniformity, and allowing in-depth analysis, this approach leads to more precise and actionable insights. For instance, recognizing specific qualitative differences could reveal proteins that failed to generate an appropriate immune response or identify proteins where one ELISA kit may outperform another. By consolidating the analysis of multiple gels/blots into a single project, you are positioned to achieve deeper insights and more impactful scientific outcomes.