Presence filter
HCP antibody coverage assessment is essentially a qualitative analysis of the spots on your images. You want to know whether a spot is present or absent from a particular image; its precise spot abundance is not your main interest. Nevertheless, categorization of spots as absent or present occurs on the basis of a spot abundance threshold (intensity or volume).
You will find that determining a single abundance threshold to separate absent from present spots is not always easy. When you look at the spots on your image, you may feel comfortable fixing a value below which you consider spots as absent. And there likely is a limit above which you confidently regard spots as present. But there often is a gray zone: between the two thresholds, you may want to treat some spots as absent and others as present, depending on a range of factors such as shape, size and position. This is because spots may reveal to be artifacts, or their abundance may be overestimated due to the spot’s overlapping with a neighboring spot. Spot abundance may also be underestimated due to saturation.
In the Presence filter step, you can therefore set spot abundance thresholds to categorize spots as absent, present or uncertain. You can then quickly review the uncertain spots in the Coverage step.
How to
Oversee your filters
The Filter table at the top left of the screen lists all images to be filtered.
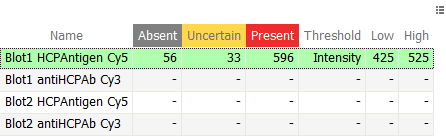
Above the table, you can read the name of the image for which you are currently adjusting the filter criteria. At the very top, the line Image X/Y mentions the sequence number of the current image (X) and the total number of images to be filtered (Y).
The Filter table summarizes the following information:
- Name – The name of the image.
- Threshold – The spot abundance criterion (Intensity or Volume) used to filter the spots on the image.
- Low, High – The threshold(s) chosen for categorizing images as absent, present and possibly uncertain (if the Low and High values are different).
- Absent, Uncertain, Present – The number of spots categorized as absent, uncertain and present following the application of the filter thresholds. The color coding of the column headers corresponds to the colors of the spots in the Display area, the Spot table and the Filter slider.
Examine your spots
Display area
You can take a close look at the spot pattern of the selected image in the Display area. The 3D view is particularly useful here.

TIPS
Use a mouse with a scroll wheel to avoid frequent mode changes to move, zoom and rotate images or increase peak height in 3D view. You will appreciate the simplicity and time savings of using the scroll wheel to manipulate your images.
The default peak heights in the 3D view may give you the impression that many spots are absent. When you increase the peak height however, you will often find that there is a real protein signal. So it is important to adjust the peak height properly. At any moment, you can increase or decrease the peak heights in the 3D view by rolling your mouse scroll wheel while holding the Ctrl key.
At the right of the Display area, you will find the standard Toolbar to manipulate the image views, and set the visualization options. You can also access the spot editing tools. As it is better to view all images during the spot editing process, and this is not possible here, you can switch to the Spot edition step to do the required spot editing and then come back to the Presence filter.
The spots on the image are color-coded according to their State (Absent, Uncertain, Present) following application of the filter thresholds.
Spot table
The Spot table displays the spot abundance values (Intensity, Area, Vol, %Vol) for each spot in the image being filtered. The abundance criterion used for the filter (e.g. Intensity) shows its cells colored according to whether the spot will be considered absent (gray), uncertain (yellow) or present (red). You can click on one or several spots in the Display area to look up their abundance value in the Spot table for use in the filter slider.

Set filter thresholds
You can set filter thresholds with the slider at the bottom of the screen.

First select the abundance criterion you want to use for the filter, by choosing the desired option (Intensity or Volume) from the drop down above the slider. In most cases, Intensity works best. Then set the filter thresholds. You can do this in two ways:
- Manually enter abundance thresholds in the boxes above the slider: the value below which all spots are considered absent in the left box and the value above which all spots are considered present in the right box. Spots with values between the two thresholds will be tagged uncertain and will require review in the Coverage step. Note that at the left and right of the colored slider, you can respectively see the minimum and maximum abundance values in the image. The thresholds must lie between these two numbers.
- Drag the slider between the colored areas to set the thresholds.
Note how the slider is automatically updated when you change the values in the threshold boxes, and vice versa. The spot colors in the Display area and Spot table are updated as well.
TIP
You can filter based on a single threshold instead of two, by entering the same value for the two thresholds. This will tag your spots as either absent or present, without any uncertain spots.
The three buttons below the slider indicate the number of absent, uncertain and present spots. You can click on a button to select the corresponding spots on the image and in the Spot table.
Navigate between images
After you finish configuring the filter for an image, you can set the filter thresholds for the following image:
- Click the Back or Next buttons to proceed to the previous or next images, respectively.
![]()
![]()
- Click the black drop down arrow next to the bold image name above the Filter table.
- Click on the name of an image in the Filter table.
- Click the black drop down arrow on the Presence filter step and choose an image name. This shortcut is particularly useful when you are in a different workflow step, such as Coverage, and would like to adjust the filter thresholds before proceeding.

Review your coverage results
The spot presence information resulting from the filters allows Melanie to tell what protein spots are only on the primary image, only on the secondary image or on both images. And consequently to calculate the coverage.
In the Coverage step, you will be able to review and edit the coverage results.
![]()
Once you are familiar with the notions and tools in the Coverage step, and especially if you analyze more than two images in a single project, you can review your presence assignments across all images by clicking the Presence summary button that can be found above the Filter table (at the right of the Next arrow). This will open the Presence summary screen.