Review
The Review step offers various tools to verify your alignment and detection results. This way you can ensure your data set is ready for statistical analysis. You can filter spots based on advanced selection criteria, edit spots, and review the normalization settings.
How to
Use the Group table
Sort the values in your columns in the Group table to review or select spots, or click the Filter by values icon to apply simple selection criteria to your spots. You can create spots sets to tag the selected spots, combine different selection criteria by combining spot sets, and annotate spots.
Filter spots
Filtering essentially consists of selecting spots and then excluding the selected spots, or alternatively, the unselected spots. Spots that you may want to exclude from your analysis are spots outside the gel area, tiny or faint background spots, or other artefacts. You can select these spots by clicking on individual spots or drawing a box around spots, which requires that you have the Select mode activated. You can also set selection criteria.
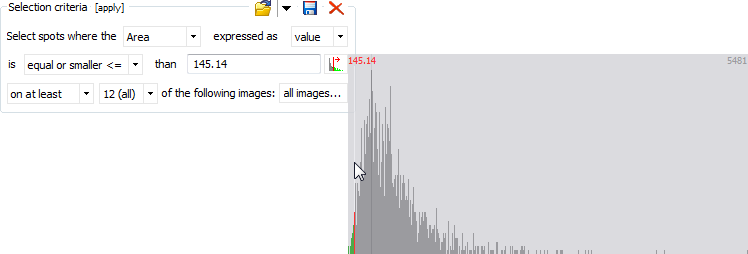
Selection criteria
The Selection criteria box allows you to specify advanced selection criteria based on a spot quantity (Intensity, Area, Vol, %Vol, Vol Ratio) that should be larger/smaller than a given threshold on at least/at most a certain number of images, or than the mean or median values for the selected images. The threshold can be entered manually, or you can click on the Choose value icon to select a threshold from a frequency histogram for the selected spot quantity.
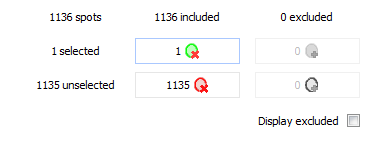
Exclude/include spots
Once you have selected spots, you can use the Include/Exclude table to include or exclude spots for further analysis. The columns in this table give you the number of spots that are currently included in and excluded from the analysis. The rows give the number of spots that are selected or unselected. The four buttons at the row and column intersections allow you to include or exclude the selected or unselected spots. The tooltip that appears when you hover over a button will tell you exactly what operation will be carried out, and to what number of spots it applies.
By default, excluded spots will not be displayed on the images and in the Group table. Click Display excluded to visualize them anyway. Excluded spots show up with a different color.
You can also directly exclude spots from further analysis by ticking the corresponding box in the Excluded column of the Group table. Tick the box again to include the spot. If you have several spots selected, the tick/untick will be applied to all selected spots.
Edit spots
Melanie lets you edit your spots. However, when you notice inconsistent spot shapes, it is wise to first review the alignment in this area. To do so, click the black drop down arrow on the Alignment step and choose an alignment pair. This will bring you back to the alignment of this particular image pair, in the area you are currently viewing.

After correcting the alignment and redoing detection (using the same parameters), you can edit spots.
Spot editing tools
The spot editing tools can be found at the right of the Display area, below the Toolbar. Then click on the desired tool to edit the spot. Note that if your project was locked for editing, you must first confirm that you really want to edit spots and change existing results (such as validations, spot sets, annotations). You can undo spot edits by clicking the Undo icon at the bottom right of the program window.
TIPS
Remember that the same spot pattern is applied to all images in your experiment. Editing a spot shape on one image will also modify the shape on the other images. It is therefore recommended to visualize all images by choosing an appropriate option under the Layout icon in the Toolbar.
You can edit spots both on the 2D and 3D views, even if some edits can be a little trickier on the 3D view.
Tick the Display excluded box to visualize all spots and avoid that newly created or edited spots overlap with excluded spots.
The following editing operations are supported:
![]() Create spots
Create spots
Click and drag to draw the outline (oval) of a new spot.
![]() Delete spots
Delete spots
Click on a spot to delete it. Click and drag to define an area in which all spots will be deleted.
![]() Split spots
Split spots
Draw a line through a spot at the position where the separation should occur. Make sure you start and finish outside the spot.
![]() Merge spots
Merge spots
Draw a trajectory through several spots.
![]() Grow spots
Grow spots
Outline the area you would like to add to the spot.
![]() Shrink spots
Shrink spots
Outline the area you would like to suppress from the spot.
![]() Move spots
Move spots
Click and drag a spot to move it only on this particular image.
Identifying edited spots
Spots that were edited appear ticked in the Edited column of the Group table. This is useful when you want to select and show those spots for review and reporting.
Normalize spots
Melanie offers various normalization options to enable comparison of protein quantities between different images. Read more about how normalization is performed and what the different settings mean. By default, Ratiometric normalization is applied.
Click the Spot normalization button in the Review step to apply different normalization settings, or to review the normalization after you filter out a significant number of spots. Melanie will also request you to review the normalization when high corrections are applied. Note that the warning message about high corrections does not necessarily mean that the normalization is wrong. The software just considers it useful to review the normalization.
Normalization settings
- You can choose from one of the following normalization methods in the Use box:
- Ratiometric normalization
- Spike normalization
- Total volume normalization
- No normalization
- You can specify image groups within which normalization shall be performed. Note that this setting is not available for DIGE data sets using and internal standard.
- Entire data set
- Alignment setup groups
- Levels for a given factor
Normalization factor table
The normalization factor table displays the following information:
- Image – The name of the image being normalized.
- Reference – The name of the reference image for the normalization. This column will only appear when an option other than Entire data set is selected in the within box.
- Factor – The normalization factor for the image being normalized.
- Markers / Spikes / Spots – The number of spots used to calculate the normalization factor for the selected normalization method.
- MFE – The Mean Fitting Error is the geometric mean of the Fitting errors of all spots in the particular image. The Fitting errors are shown in the Normalization table. The magnitude of the MFE will depend on the ‘Display ratio as’ option in General options > Quantification. Nevertheless, lower MFE will indicate better fitting. It is therefore recommended to look for minimized MFE when choosing between normalization options.
- Fitting – The Fitting corresponds to the slope of the simple linear regression between the Normalized spot volume in the sample image and the Normalized spot volume in the reference image, when the fitting line is forced through the origin. Optimal normalization should give Fitting values close to 1.
Images with a high normalization factor will be highlighted. It is wise to review the normalization for all images systematically, with the Back and Next buttons, to make sure that high corrections are not due to some bias or artefact in your experiment.
Normalization plot
Red spots in the Normalization plot are used for the calculation of the normalization factor, whereas violet spots are not.
Hovering over a spot will show a tooltip with information about the volumes in the two images, as well as the Volume ratio and Mean volume for that spot (non-normalized).
You will find some specific functionality in the normalization plot:
- Filter by values icon – Select spots with a Volume ratio that lies within a given range.
- Normalization table icon – Toggle to show/hide the Normalization table.
Click the Options icon at the top right of the Normalization plot and then choose Display to choose the type of Normalization plot (MA plot, Log ratios plot).
Normalization table
The Normalization table displays the Volume ratio, Mean volume, Volume on the sample image and Volume on the reference image for each spot (non-normalized). Note that these values also show up when hovering over a spot in the Normalization plot.
The Normalization table further displays the Fitting error for each spot. The Fitting error of a spot can be defined as the vertical distance of the spot to the Median (red line) in the Normalization plot. Mathematically, for spots above the Median, the Fitting error corresponds to Vol Ratio*Factor. For spots below the Median, the Fitting error is calculated as 1/(Vol Ratio*Factor). The symmetrical behavior of the Fitting error allows selection of both under- and over-expressed spots with high or low Fitting error.
When Ratiometric normalization is applied, the Normalization table additionally shows the column Markers. The box in this column is ticked for spots that are used to calculate the normalization factor. The content of this column is not editable. When choosing Spike normalization, the Normalization table will display the Spikes column instead. The boxes in this column are editable. This means you can tick a box to define the corresponding spot as a spike protein.
Using the Settings icon in the Normalization table, you can show additional columns. These include the normalized volumes on the sample and reference images. The Ac column could be handy if you want to indicate protein accession numbers while you specify your spike proteins.